Securing public support is essential for the implementation of climate policies, but it is challenging (Carattini et al. 2019). Even though the topic of the equity impact of climate policies is gaining political and scientific attention (Baranzini et al. 2017), existing research is mostly aspatial, focusing on inequalities between people of different income levels and neglecting inequalities between households living in different locations (Dorband et al. 2019, Ohlendorf et al. 2021). This is particularly problematic for transportation policies in urban areas, as policies with spatially differentiated impacts have already led to large-scale protests from suburban dwellers, such as the ‘gillets jaunes’ (‘yellow vests’) in France.
In a new paper (Liotta et al. 2022) taking the city of Cape Town, South Africa, as a case study, we put the spatial dimension at the core of the analysis. We analyse how a simple 20% fuel tax might impact households of different levels of income, but also living in different types of housing and locations within the city. The question of the timeframe is also central here: in the short run, suburban dwellers commuting by polluting transportation modes will be heavily impacted by the tax, whereas in the long run, households will have the chance to adapt, with unclear consequences on households’ welfare.
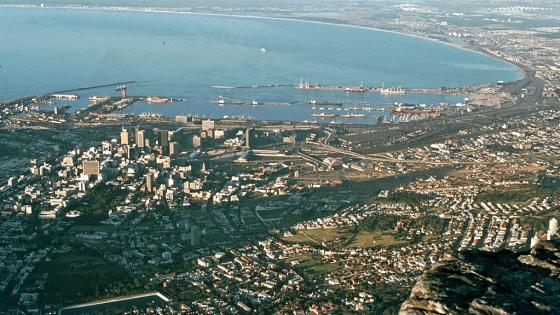
A segregated city
Cape Town has both one of the highest income inequality levels in the world and a segregated city structure largely inherited from the apartheid era. The richest households can afford large dwellings far from the city centre, commuting by private cars, whereas middle-income households live closer to the city centre and commute by private cars and public transport. Finally, low-income households are usually tied to locations far from the city centre: subsidised houses, provided for free by the state, are in the suburbs, and informal housing takes place either on vacant land or in the backyards of subsidized houses, far from the city centre in both cases. This means that low-income households, who cannot afford private cars, rely on public and informal public transportation (buses or local minibuses/taxis), resulting in long and expensive commutes (Teffo et al. 2019, Vanderschuren et al. 2021).
Persisting inequality impacts of the fuel tax
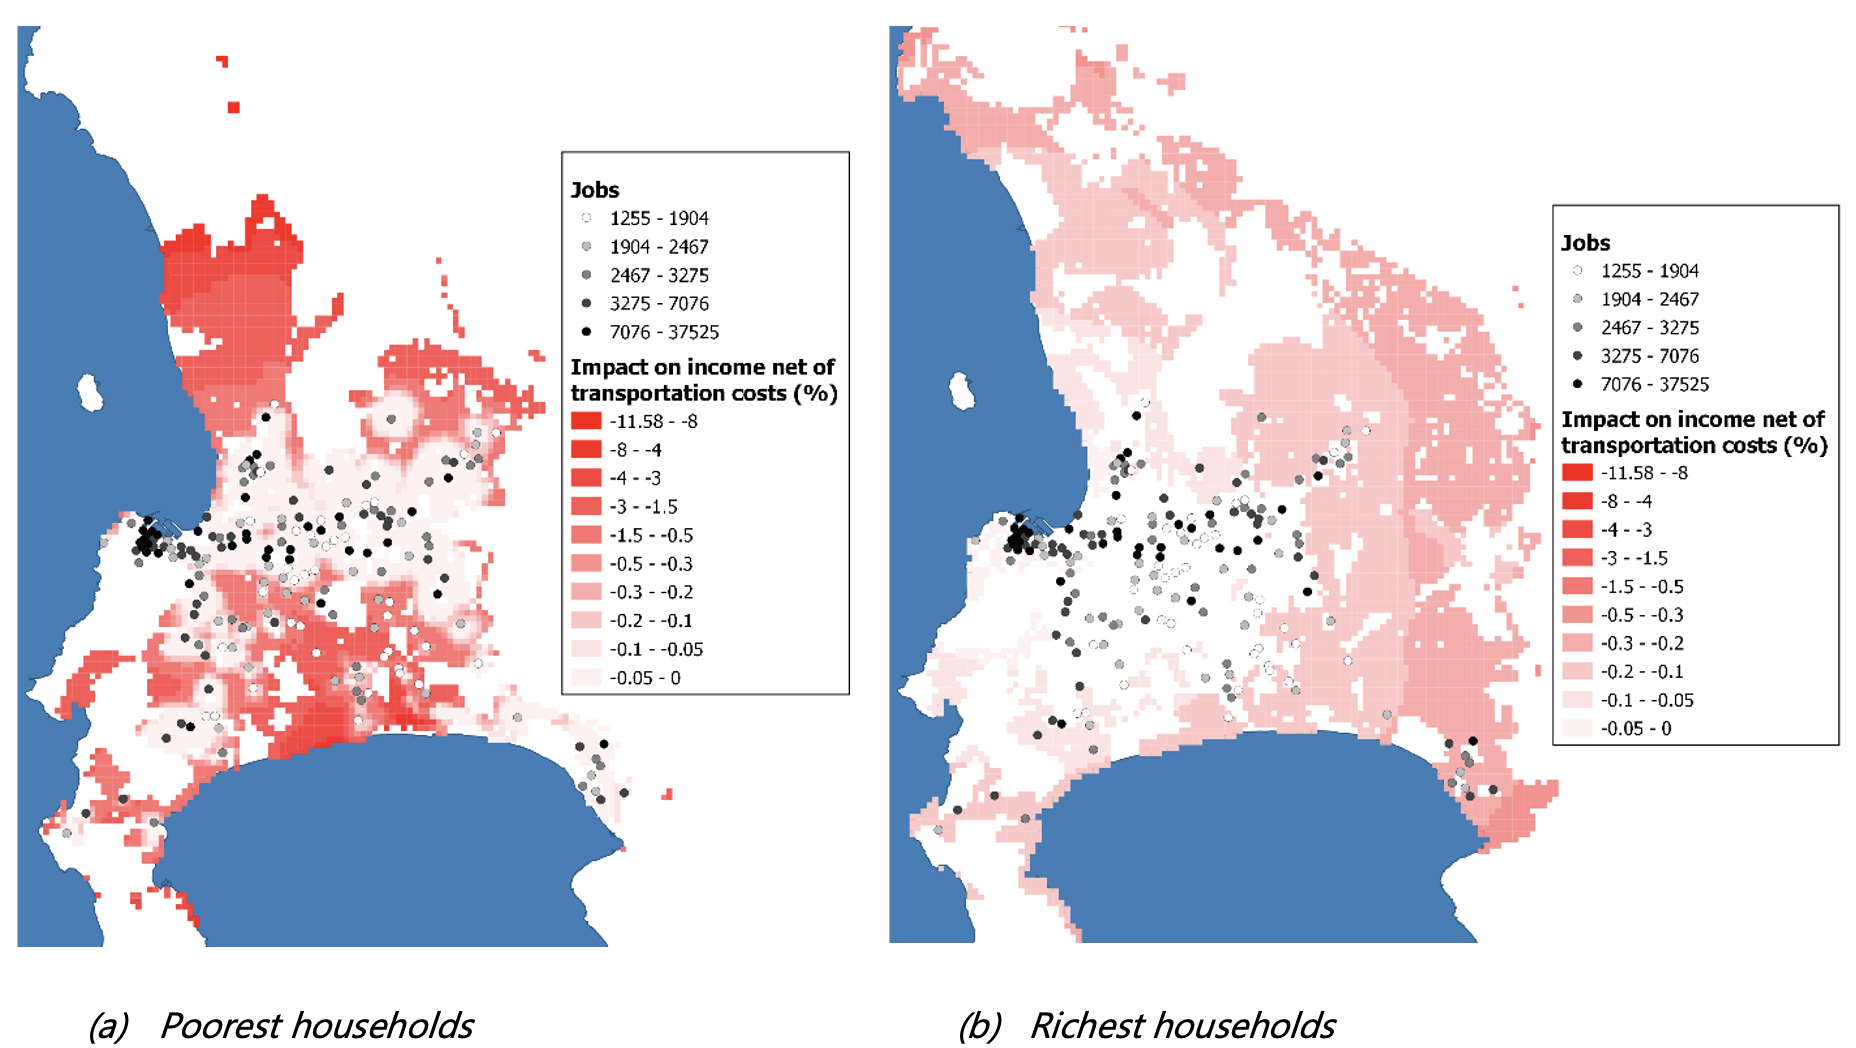
We find that low-income households and households living in the periphery are the most affected by the fuel tax in the short term. But in the medium run, households can switch transportation modes and employment centres to adapt to the tax, and households more affected in the short run are more likely to adapt in the medium run. After that, homeowners increase and decrease rents to adapt to the new transportation conditions and housing demand in each location, and in the long run, households can adapt to the new state of the housing market by changing dwelling size or housing location and type.
Figure 1 Direct impacts of the fuel tax on incomes net of generalised transportation costs
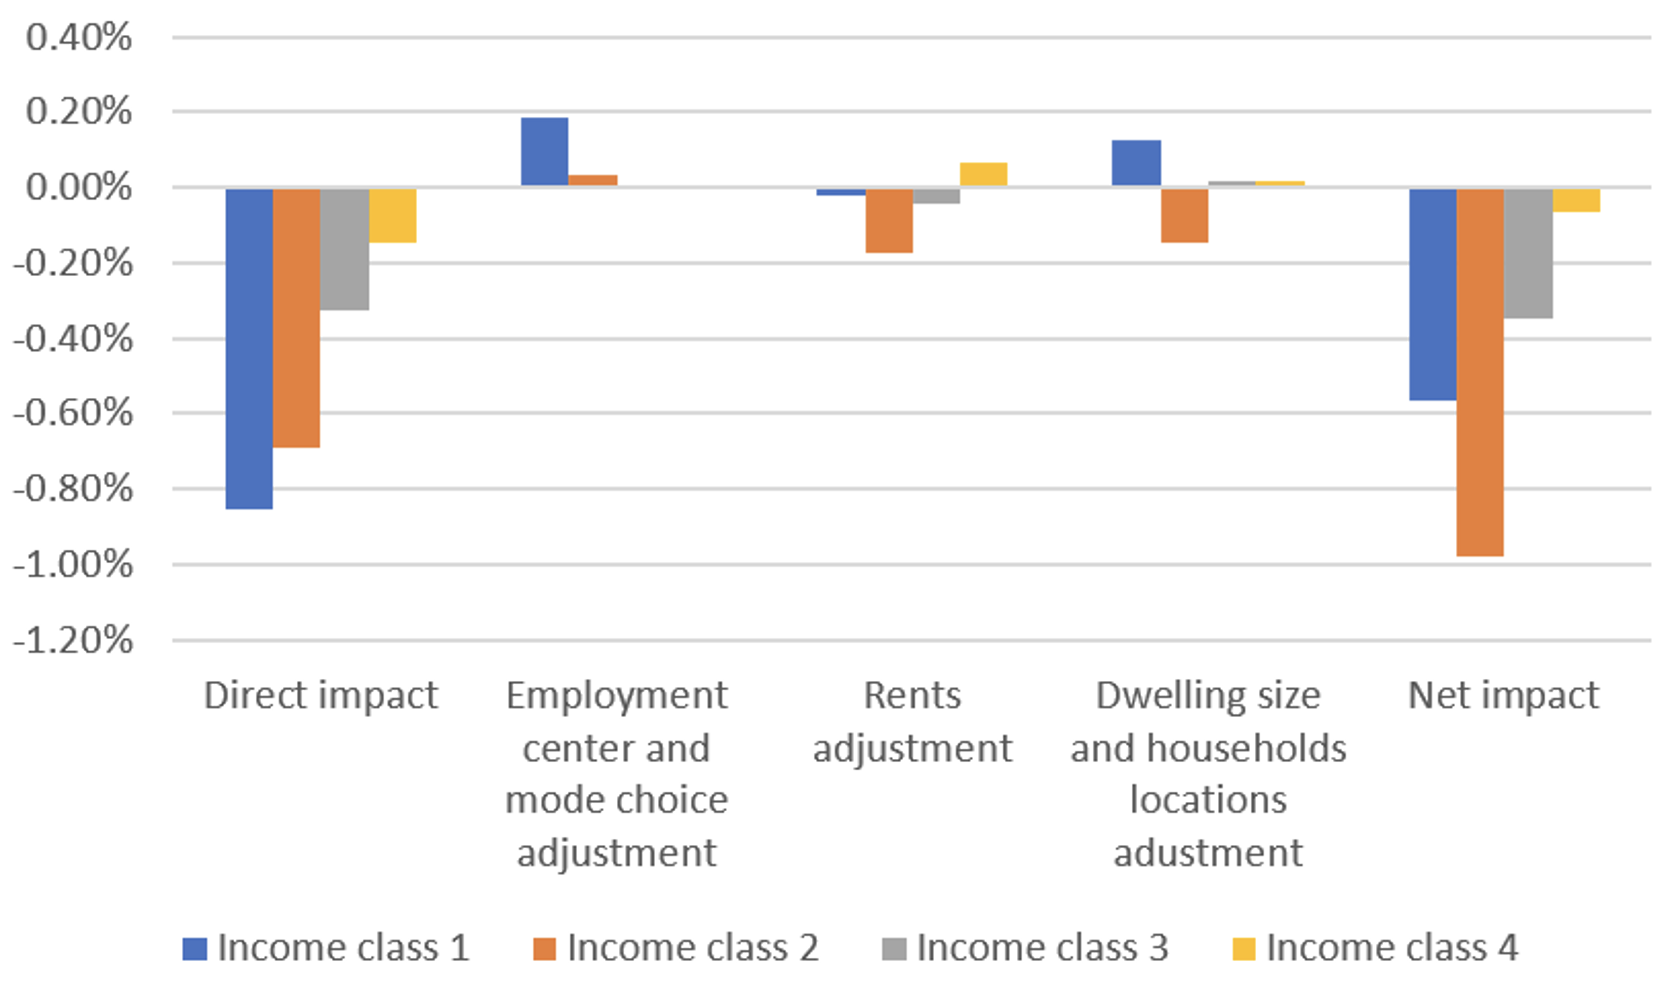
Still, we find persisting inequalities generated by the fuel tax in the long run. Lower-middle-income (-0.98%) and low-income (-0.57%) households suffer the highest welfare losses compared to a scenario without a fuel tax, followed by higher-middle-income households (-0.35%), while high-income households are almost unaffected (-0.06%). Why do we observe these persisting inequalities?
An explanation is that the poorest households, living in informal settlements or subsidised housing, have few or no ways to adapt to changes in fuel prices: as they cannot afford formal private housing, they are tied to urban peripheries, and remain over-reliant on public or informal transport. In addition, households living in subsidised housing cannot adjust their housing location and type: the subsidised housing programmes significantly improve the welfare of low-income households but do not provide flexibility and make them less resilient to shocks on transportation costs. Low-income households living in formal housing also remain impacted by the tax over the long term due to complex effects driven by the competition with richer households in the housing market.
Figure 2 Welfare impacts decomposition by income class over time
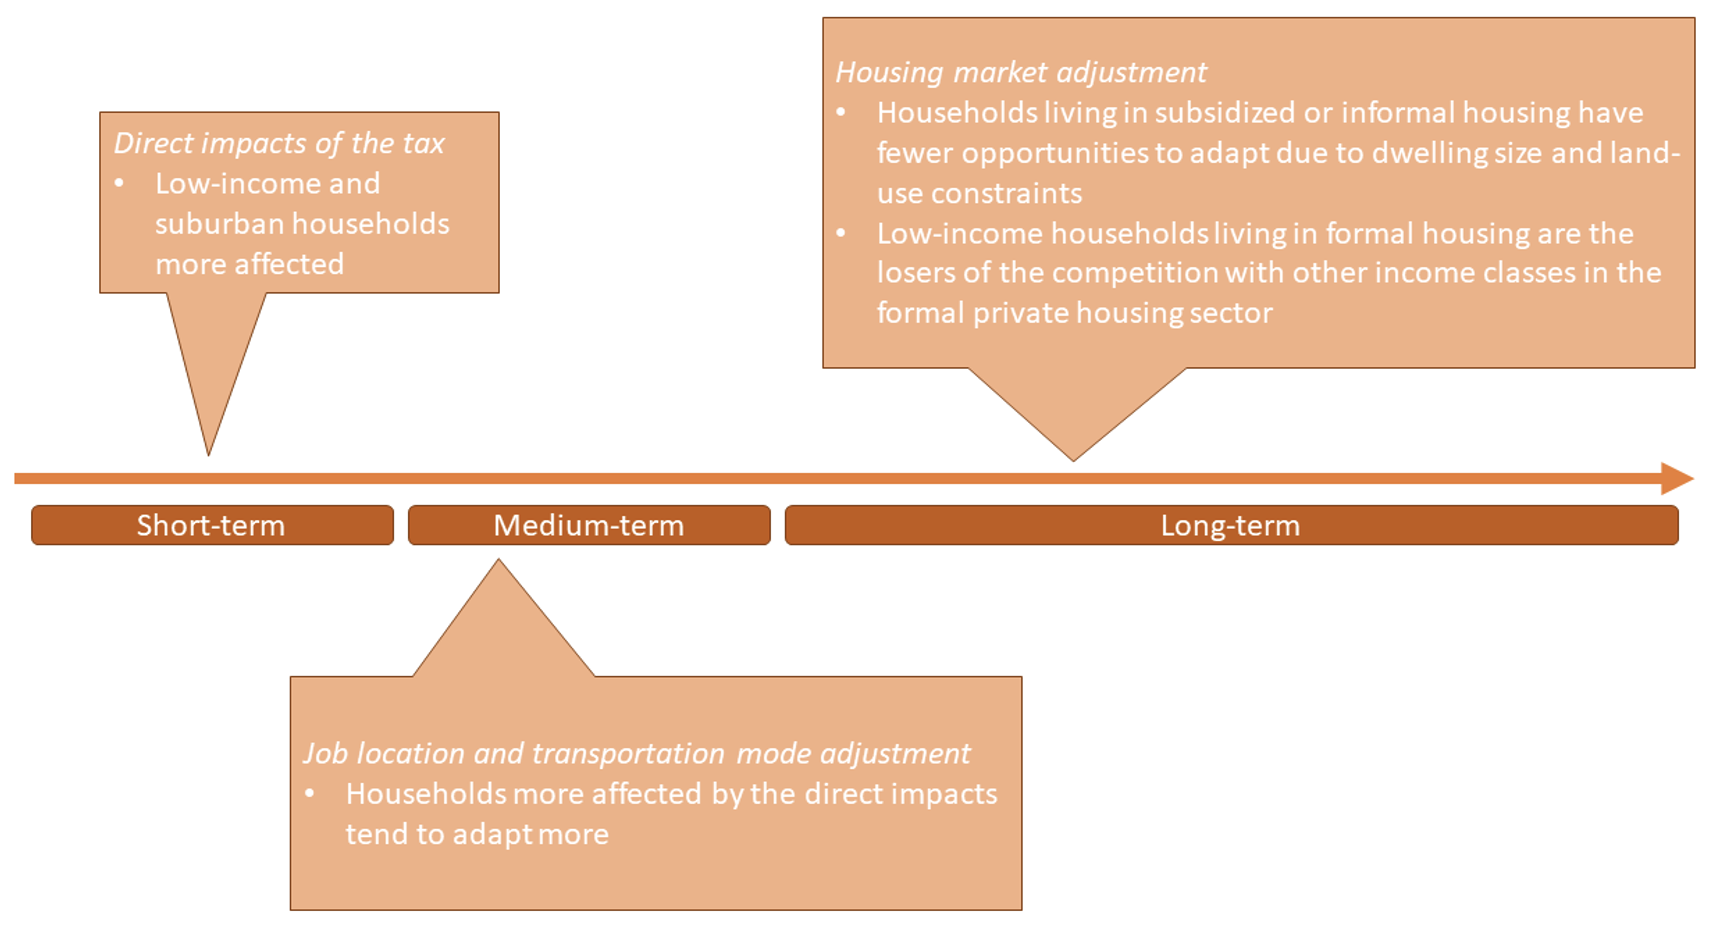
The timing of adjustments also matters for spatial inequalities. Whereas it is possible to switch transportation mode overnight, changing employment centres or even housing locations and dwelling sizes comes with transaction costs and takes time, so the direct impacts of the fuel tax will persist.
Figure 3 Short-, medium-, and long-term impacts of the fuel tax
Complementary policies
Complementary policies that seek to reduce frictions could possibly help the most affected households adapt to the fuel tax. Possible candidates include policies that promote a more fluid labour market allowing households to change jobs easily; affordable and/or decarbonised public transportation; and housing subsidies helping low-income households to rent houses closer to employment centres. These complementary interventions could improve the social acceptability of climate policies.
References
Baranzini, A, J C J M van den Bergh, S Carattini, R B Howarth, E Padilla and J Roca (2017), "Carbon pricing in climate policy: seven reasons, complementary instruments, and political economy considerations", WIREs Climate Change 8, e462.
Carattini, S, S Kallbekken and A Orlov (2019), "How to win public support for a global carbon tax", Nature 565: 289–291.
Dorband, I I, M Jakob, M Kalkuhl and J C Steckel (2019), "Poverty and distributional effects of carbon pricing in low- and middle-income countries – A global comparative analysis", World Development 115: 246–257.
Liotta, C, P Avner, V Viguié, H Selod and S Hallegatte (2022), "Climate Policy and Inequality in Urban Areas: Beyond Incomes", World Bank Policy Research Working Paper.
Ohlendorf, N, M Jakob, J C Minx, C Schröder and J C Steckel (2021), "Distributional Impacts of Carbon Pricing: A Meta-Analysis", Environmental Resource Economics 78: 1–42.
Teffo, M, A Earl and M H P Zuidgeest (2019), "Understanding public transport needs in Cape Town’s informal settlements: a Best-Worst-Scaling approach", Journal of the South African Institute of Civil Engineering 61.
Vanderschuren, M, R Cameron, A Newlands and H Schalekamp (2021), "Geographical Modelling of Transit Deserts in Cape Town", Sustainability 13: 997.
