Recent global housing market trends have, once again, underscored the issue of housing affordability (Favilukis et al. 2019). The COVID-19 recession saw an unexpected surge in house prices in many nations, driven by a mix of demand and supply factors, such as policy support measures and lockdown-related constraints on construction. The challenge in assessing housing affordability lies in the inadequacy of existing cross-country indicators. Traditional measures like the price-to-income ratio and OECD’s housing cost overburden rate, while useful, do not fully account for mortgage market dynamics and housing characteristics, which are crucial in understanding affordability.
To address this gap, in a recent paper (Biljanovska et al. 2023) we develop a new approach to measuring housing affordability for a sample of 40 OECD economies, focusing on a household's ability to make regular mortgage payments while maintaining other essential needs. The proposed housing affordability index (HAI) calculates the ratio of household income to the income required for a typical mortgage, offering a more nuanced view of affordability than previous metrics. An HAI value above 100 indicates more affordable housing. This new method contributes to the understanding of global housing affordability trends.
Affordability over time
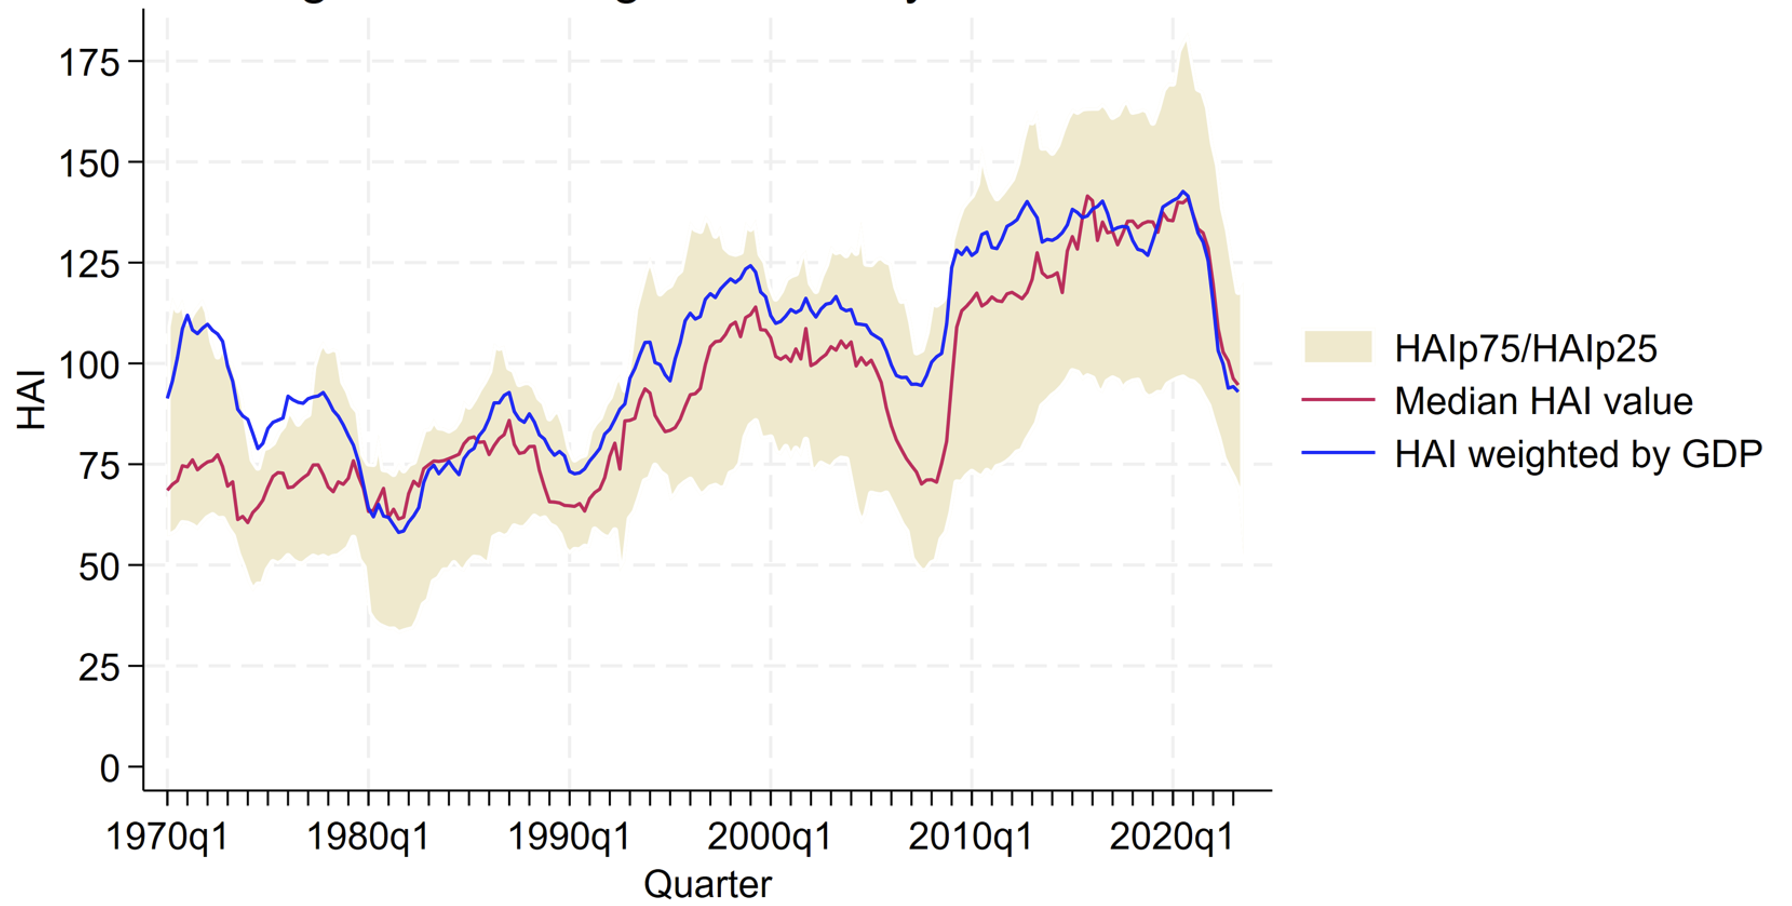
Figure 1 illustrates the mean, median, and the 25th and 75th percentiles of the HAI across countries over time. From the 1970s to mid-1990s, the median HAI was below 100, indicating challenges for median-income households in obtaining mortgages for average-priced homes. However, since the 2000s, affordability improved, consistently surpassing the 100-mark. Post-Global Financial Crisis (GFC), affordability continued to rise until the recent tightening cycle, which caused a notable decline due to persistently high prices and increasing policy rates in some countries (Gorea et al. 2022).
Figure 1 Housing affordability index for 40 countries over 50 years
Sources: Authors’ calculations; see the working paper annex for detailed information.
Notes: Housing affordability index (HAI) is the ratio between household income and a qualifying income that a household would need to earn to qualify for a typical mortgage to purchase a typical house. A value of 100 indicates that a median-income household has exactly enough income to qualify for a mortgage loan on an average-priced home; an index level of above (below) 100 indicates that a household has more (less) than the qualifying income to apply for a mortgage for a house with an average price. The average is computed using USD GDP as country weights.
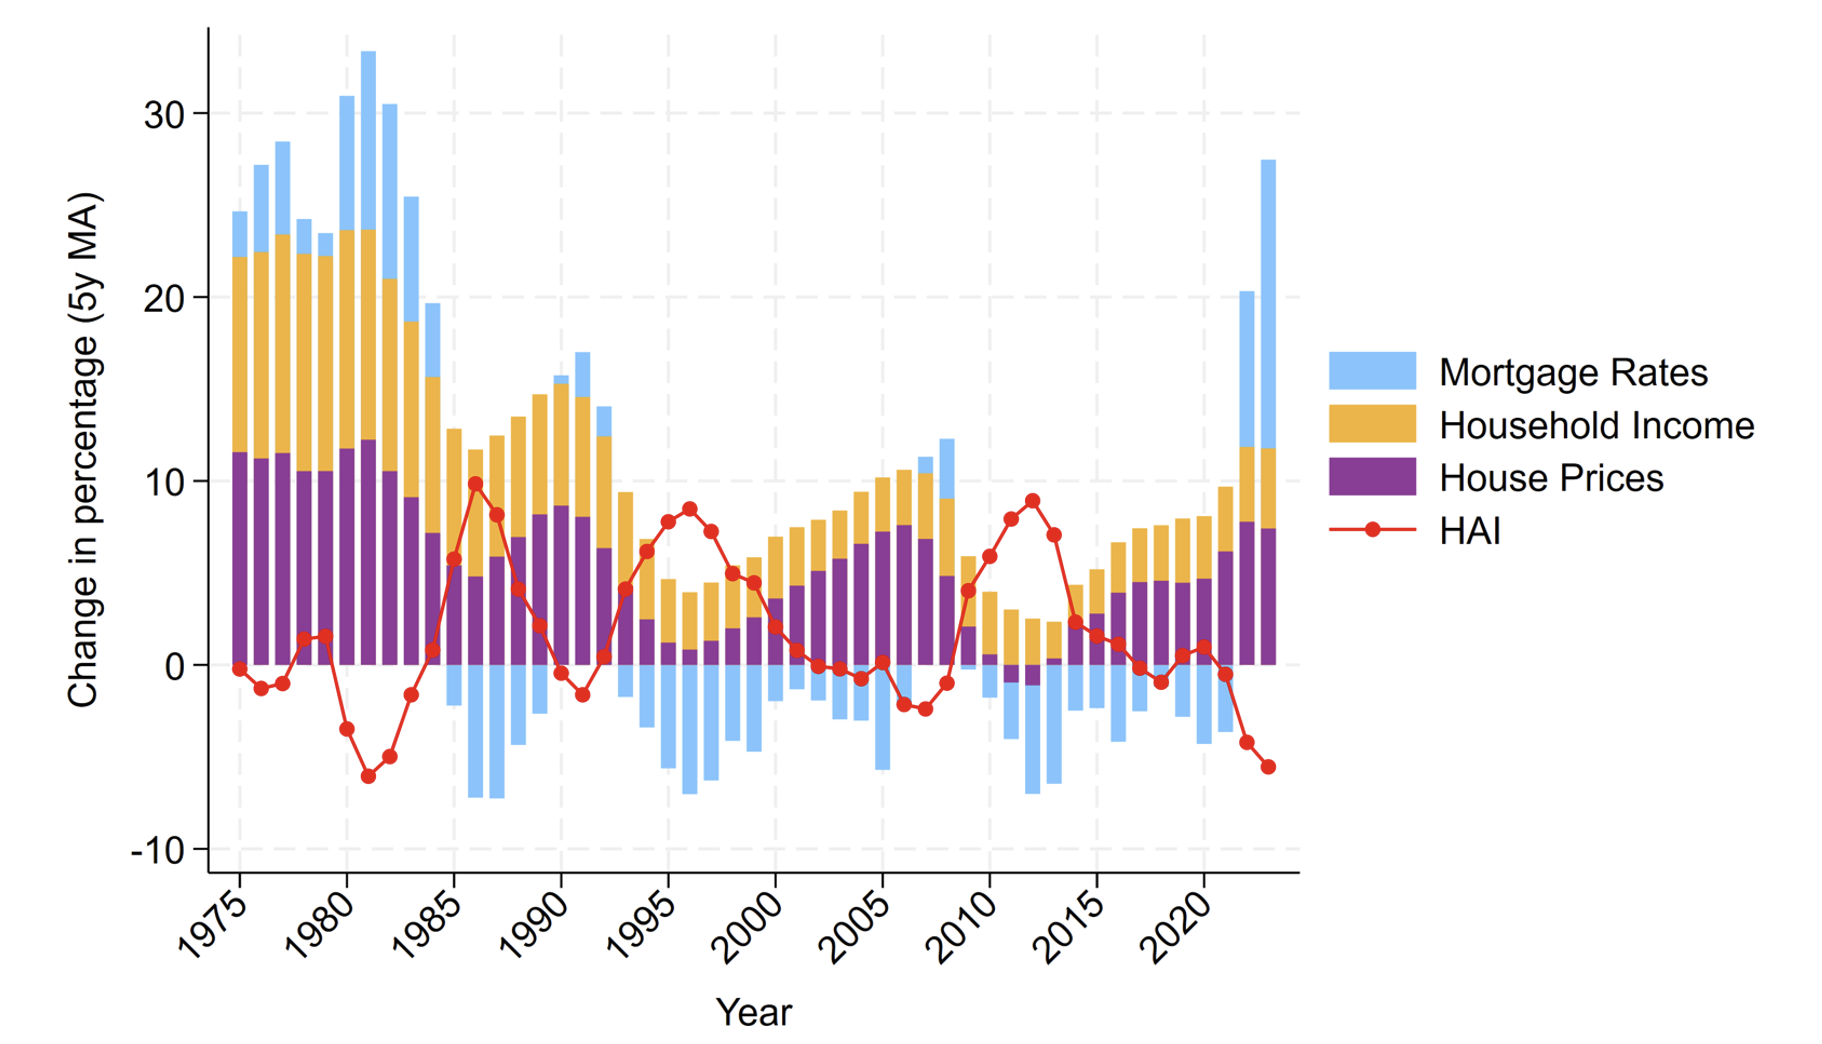
The drivers of these affordability trends can be traced to the evolution of HAI's time-varying components: nominal mortgage rates, household income, and house prices. Declining mortgage rates, reflecting a global drop in the natural interest rate and financial liberalisation, have generally supported higher affordability by reducing borrowing costs. Concurrently, both household income and house prices have increased, with house prices undergoing significant corrections during the GFC and recovering thereafter. The mid-1970s and early 1980s saw a decline in HAI due to rising house prices and borrowing rates, not compensated by household income growth. Post-GFC, lower borrowing rates and decreasing house prices improved affordability, a trend reversed during the pandemic as house prices surged.
This broad analysis, however, masks country-specific variations in the evolution of affordability. Reduced borrowing costs mainly benefit households in countries without inflated house prices. In several countries with strong house price growth, low interest rates have been insufficient to offset the impact of high property prices on affordability. For instance, Belgium saw improved affordability as lower rates balanced moderate house price increases, while in Canada affordability declined due to strong house price growth. In the UK, affordability initially worsened in the 2010s and then stabilised, reflecting the post-GFC house price rebound and slower appreciation post-Brexit.
Figure 2 Changes in the housing affordability index and its time-varying components
Sources: Authors’ calculations; see the working paper annex for detailed information.
Notes: HAI, mortgage rates, household income, and house prices represent the average year-on-year growth rates, weighted by USD GDP. Growth rates are smoothed by applying a 5-year moving average to each of the series.
Affordability across countries
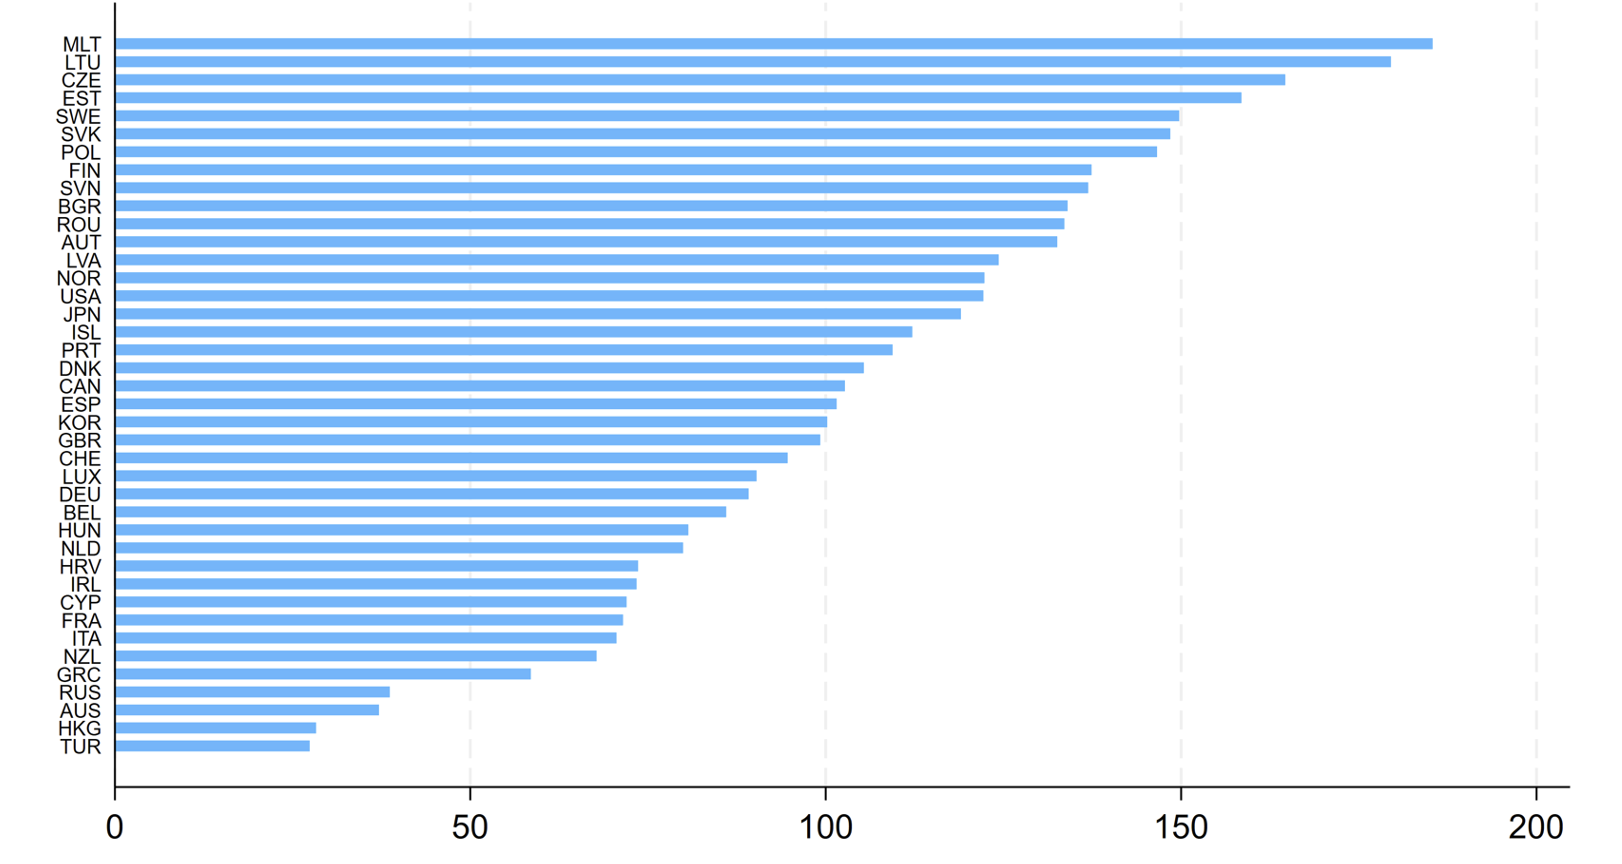
Across countries, the average HAI varies considerably, reflecting a myriad of country characteristics. Advanced economies generally exhibit higher affordability, with an average HAI of 118 compared to 85 in emerging markets from 2001 to 2021. Advanced economies also show slightly less variance in HAI than emerging markets, with standard deviations of 48 and 53, respectively. When ranking countries by average HAI, Eastern European nations like the Baltics, Czech Republic, and Poland lead, often exceeding an index value of 150, likely due to high homeownership rates and older, cheaper housing stock. In contrast, countries like Australia, Hong Kong SAR, Russia, and Türkiye show much lower affordability, each with unique contributing factors, such as rapid price increases in Australia and underdeveloped mortgage markets in Türkiye.
Figure 3 Average housing affordability index over the sample period by country
Sources: Authors’ calculations; see the working paper annex for detailed information.
Notes: For each country, the HAI is computed as the average over the sample period. The sample length varies across countries due to data availability. A value of 100 indicates that a median-income household has exactly enough income to qualify for a mortgage loan on an average-priced home; an index level of above (below) 100 indicates that a household has more (less) than the qualifying income to apply for a mortgage for a house with an average price.
Our methodology focuses primarily on mortgage repayment affordability, which has limitations. In higher GDP per capita countries, where mortgage markets are more developed, outright home ownership is low, and ownership with a mortgage is high. Here, the HAI can be particularly informative.
Another limitation is that the index does not fully address the sustainability of homeownership, like the long-term affordability of mortgage payments in the face of interest rate and income shocks or the impact of mortgage costs on other essential expenses. This point is crucial, especially now, as the median HAI has improved in recent decades mainly due to low interest rates. This improvement, largely based on current mortgage affordability, is already reversing with rising interest rates and may worsen as rate resets occur. Thus, the recent gains in HAI, particularly in the last decade, might end up being short-lived.
References
Ahir, H and P Loungani (2019), “IMF Assessments of Housing Markets Around the World”, background slides for the Annual Meeting of the International Housing Association, February.
Ahir, H, N Biljanovska, C Fu, D Igan, and P Loungani (2022), “Housing Prices Continue to Soar in Many Countries Around the World”, IMF Blog Chart of the Week, 18 October.
Beraldi, F and Y Zhao (2023), “The Pricing-Out Phenomenon in the U.S. Housing Market”, IMF Working Paper No. 2023/01.
Biljanovska, N, C Fu, and D Igan (2023), “Housing affordability: a new dataset”, BIS Working Paper No. 1149.
Deb, P, H Finger, K Kashiwase, Y Kido, S Kothari, E Papageorgiou, H Hoyle, and A Oeking (2022), “Housing Market Stability and Affordability in Asia-Pacific”, IMF Departmental Paper No. 2022/020.
Favilukis, J, P Mabille, and S Van Nieuwerburgh (2019), “Housing policies to combat the affordability crisis”, VoxEU.org, 18 October.
Gorea, D, A Kmetz, O Kryvtsov and M Kudlyak (2022), “How house prices respond to monetary policy surprises”, VoxEU.org, 4 November.
Igan, D, E Kohlscheen, and P Rungcharoenkitkul (2022), “Housing market risks in the wake of the pandemic”, BIS Bulletin No. 50.


