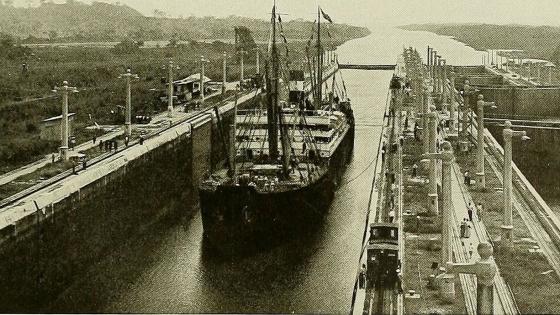
On 23 March 2021, the Ever Given ran aground in the Suez Canal. Although the canal was blocked for a relatively short time, the event disrupted supply chains around the world and altered maritime traffic patterns. The episode served as a reminder of the obvious: the world’s great man-made waterways play a central role in today’s economy. Perhaps more importantly, they may have shaped the spatial distribution of economic activity. The construction of the Suez and Panama Canals led to reductions in transportation costs that dramatically widened the range of economic opportunities available to what were, then, remote places. Recent research by Brancaccio et al. (2020) indicates that closing the Panama Canal today would reduce global welfare by 3.3%. This leads us to ask: How do changes in transportation costs affect the location of economic activity and productivity dynamics?
A key challenge that arises when addressing this question is that the placement of these projects is unlikely to be random. Decision makers might target places where the returns of these investments, economic or political, are higher. In practice, this implies that we face a complication disentangling the projects’ benefits from the underlying causes or trends that motivated them. We overcome this difficulty by studying how the Panama Canal, one of the most prominent engineering projects of the 20th century, transformed the economic geography of the Western hemisphere. In a new working paper (Galiani et al. 2022), we study how the opening of the canal affected county-level and aggregate manufacturing output, input use, and productivity in Canada from 1910 to 1939.
Though we are not the first to ask this question (Maurer and Yu 2008, Fajgelbaum and Redding 2014, Donaldson and Hornbeck 2016, Flückiger et al. 2019, Jaworski et al. 2020, Hornbeck and Rotemberg 2021, Maurer and Rauch 2022), the specific case of Canada is interesting for two reasons. First, the canal was built by the US without targeting Canadian economic outcomes. The rationale for the construction of the canal was strategic and geopolitical, as the US government considered the project for the purpose of having just one fleet to defend the country’s shores in both the Atlantic and Pacific Oceans (McCullough 1977).
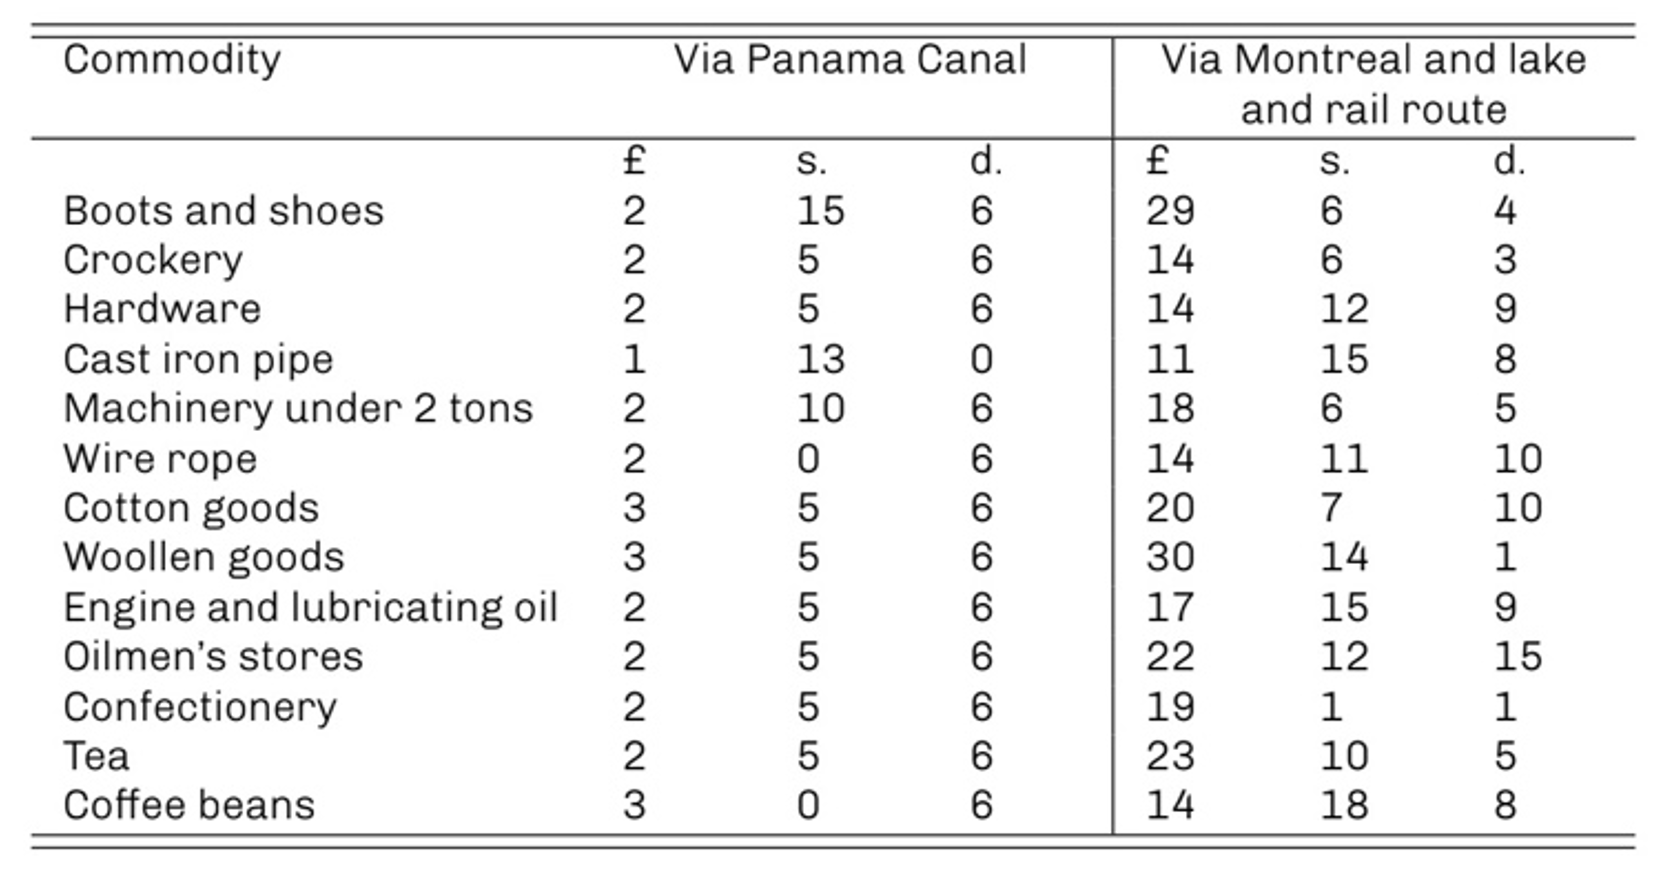
Second, Canada was set to benefit from the opening of a year-round available waterway in Central America. Plagued by extreme overland distances and extreme weather conditions during the winter, North American shipping was expensive to the point of hindering the integration of Canadian counties with key markets – both in Canada and overseas. With toll fees priced just to cover maintenance costs, the Panama Canal provided a cheap, year-round alternative to the expensive and cumbersome railroad-Great Lakes or Cape Horn routes. Table I shows savings in freight costs greater than 90% for goods shipped from Vancouver, British Columbia, to London when compared with the railroads-Great Lakes-Ocean alternative.
Table 1 Freight costs from Vancouver, BC to London, UK
Source: Innis (1933). Prices are given in pounds (£), shillings (s.), and dimes (d.)
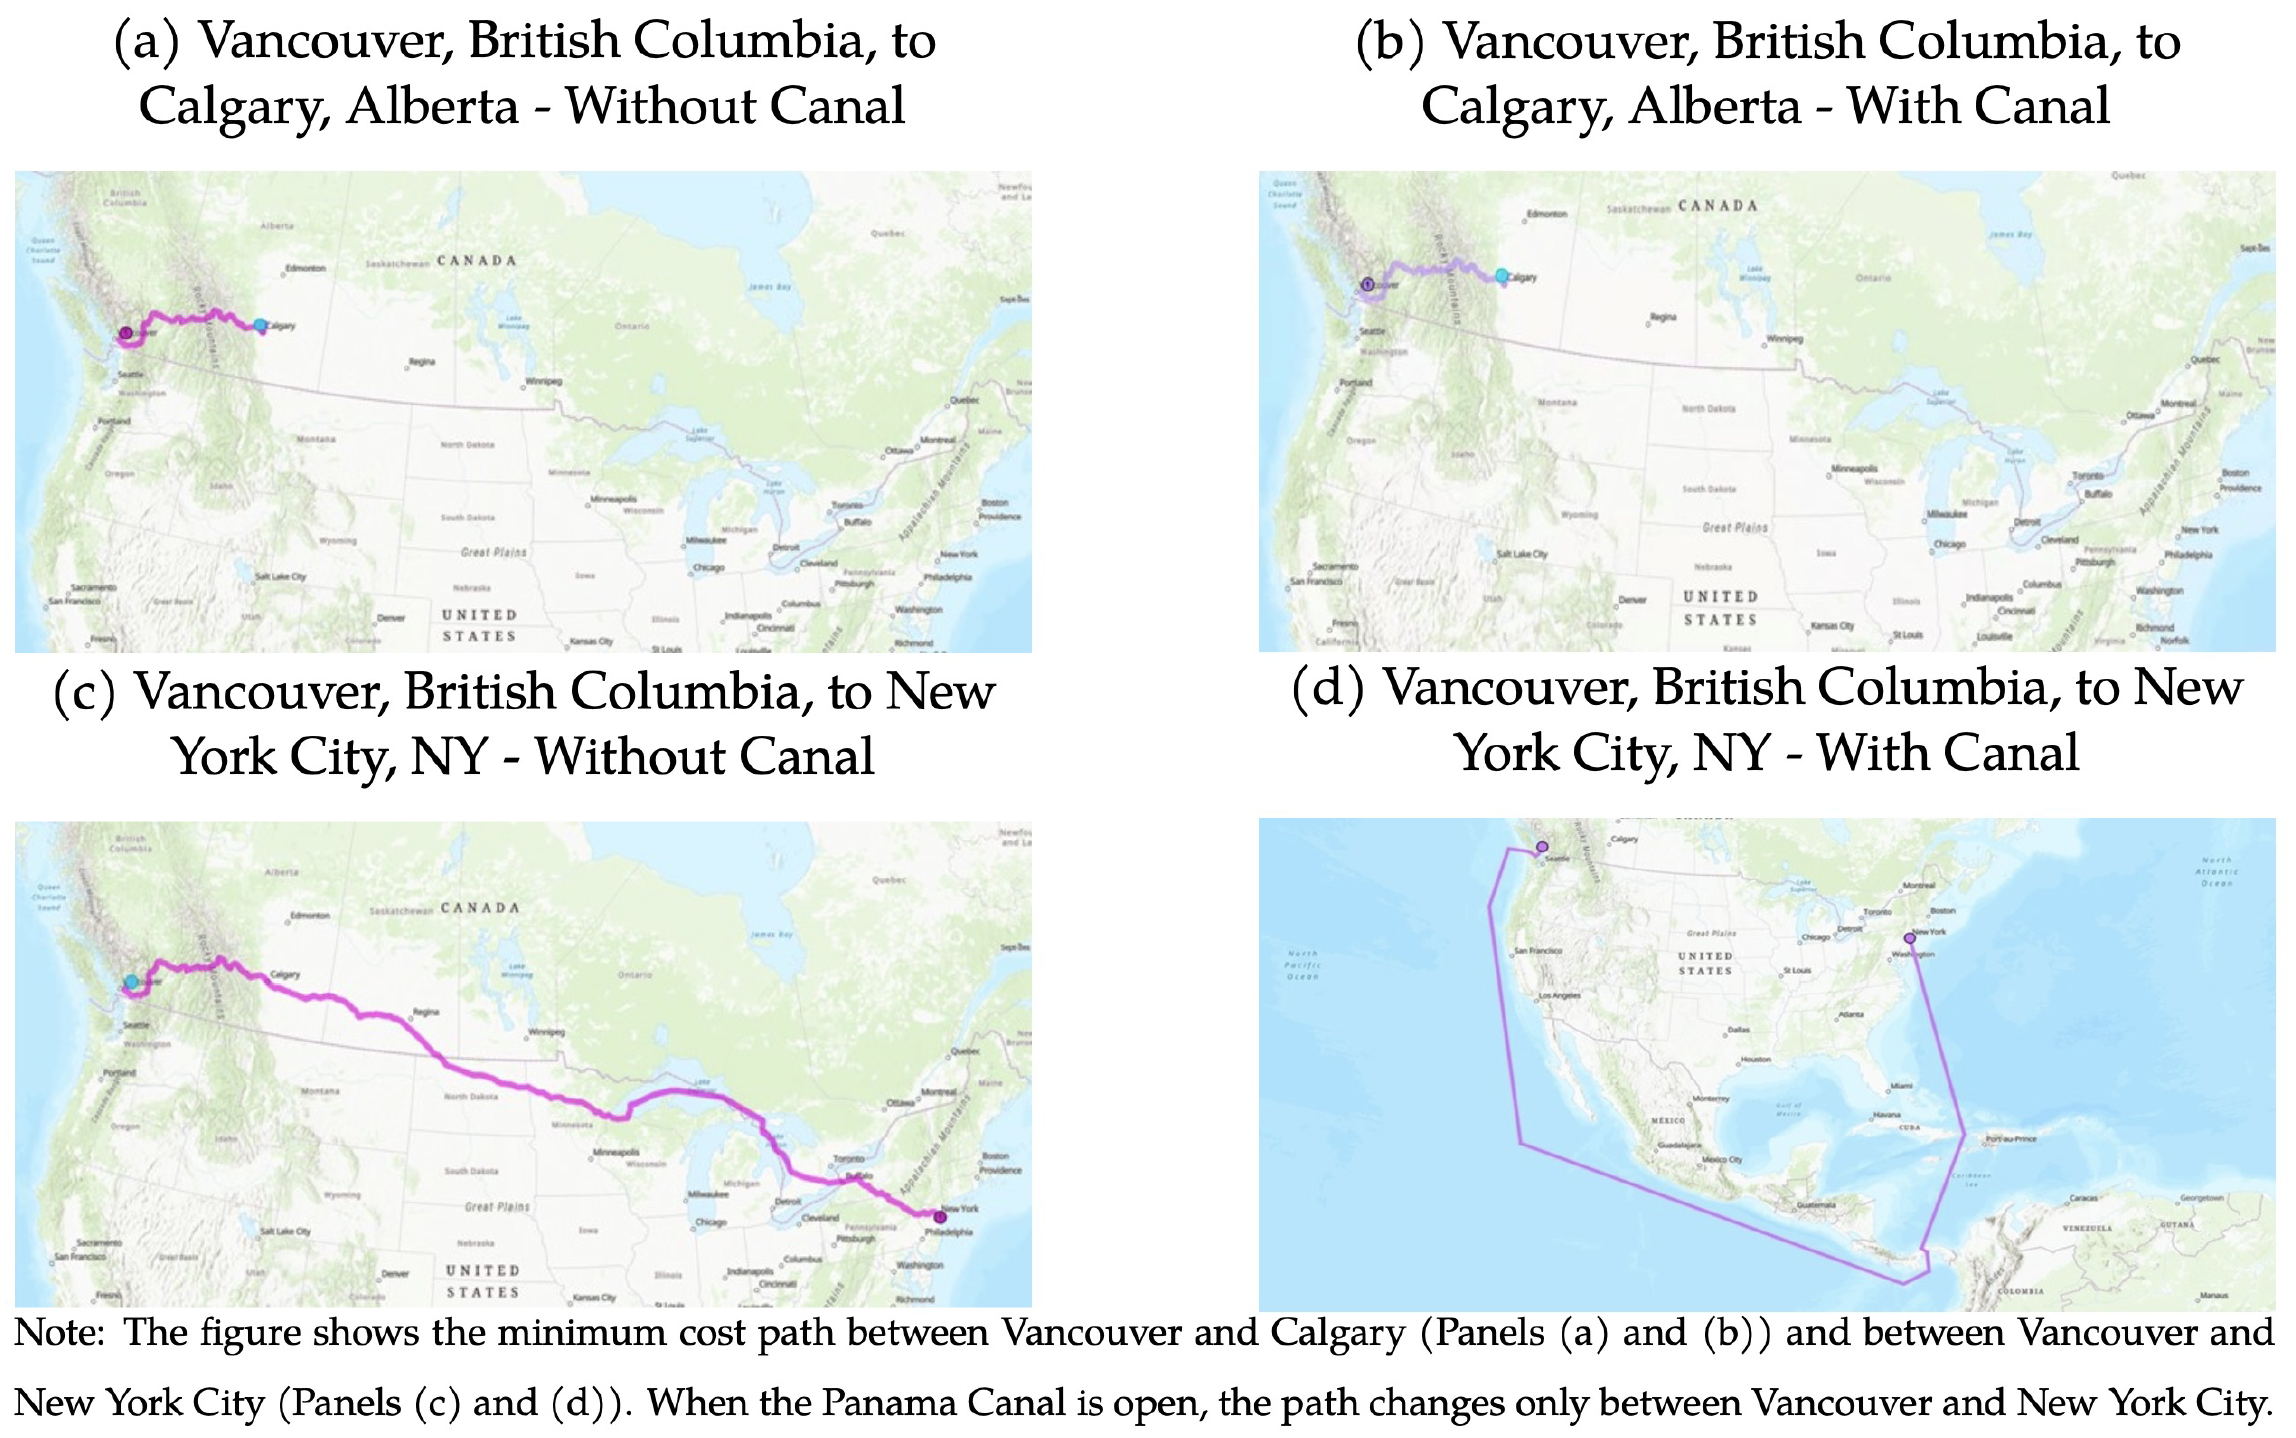
For each Canadian county, we estimate how changes in transportation costs brought about by the Panama Canal opened new economic opportunities in other markets. In practice, we calculate trade-cost weighed averages of the size of the markets to which a place might have had access in 1920 – ‘market access’ – under two alternative scenarios: one where the Panama Canal is open and one where it is closed. Figure I illustrates the practical implications of this exercise. Although the minimum-cost path (and the transportation costs) between Vancouver, British Columbia, and Calgary, Alberta, do not change between the two scenarios, those between Vancouver and New York City do change. As expected, the difference in estimated market access with and without the canal is largest for counties in the west, closer to the coast. Most counties in the east also experience sizable gains in market access from the reduction in transportation costs (Figure 2).
Figure 1 Minimum cost path illustration before and after the Panama Canal opens
Figure 2 Changes in log market access due to the opening of the Panama Canal
We track the evolution of manufacturing activity at the county level using the Census of Manufacturing from 1900, 1910, and 1939. These three censuses include information on the total value of production, input bills, and employment, which we also use to measure productivity. Moreover, we can decompose productivity into two components: Revenue Productivity (TFPR) and Reallocative Efficiency (RE) (Petrin and Lenvinsohn 2012). The former captures a classical notion that relates to the market value of the technical efficiency. The latter conveys information about the sectors and places to which inputs are allocated. Whenever an economy moves away from perfect competition, an additional unit of any given input might yield different increases in production in different places and sectors. For each county, we calculate the growth in manufacturing activity before the canal opened (1900–1910) and after (1910–1939).
Local-level results
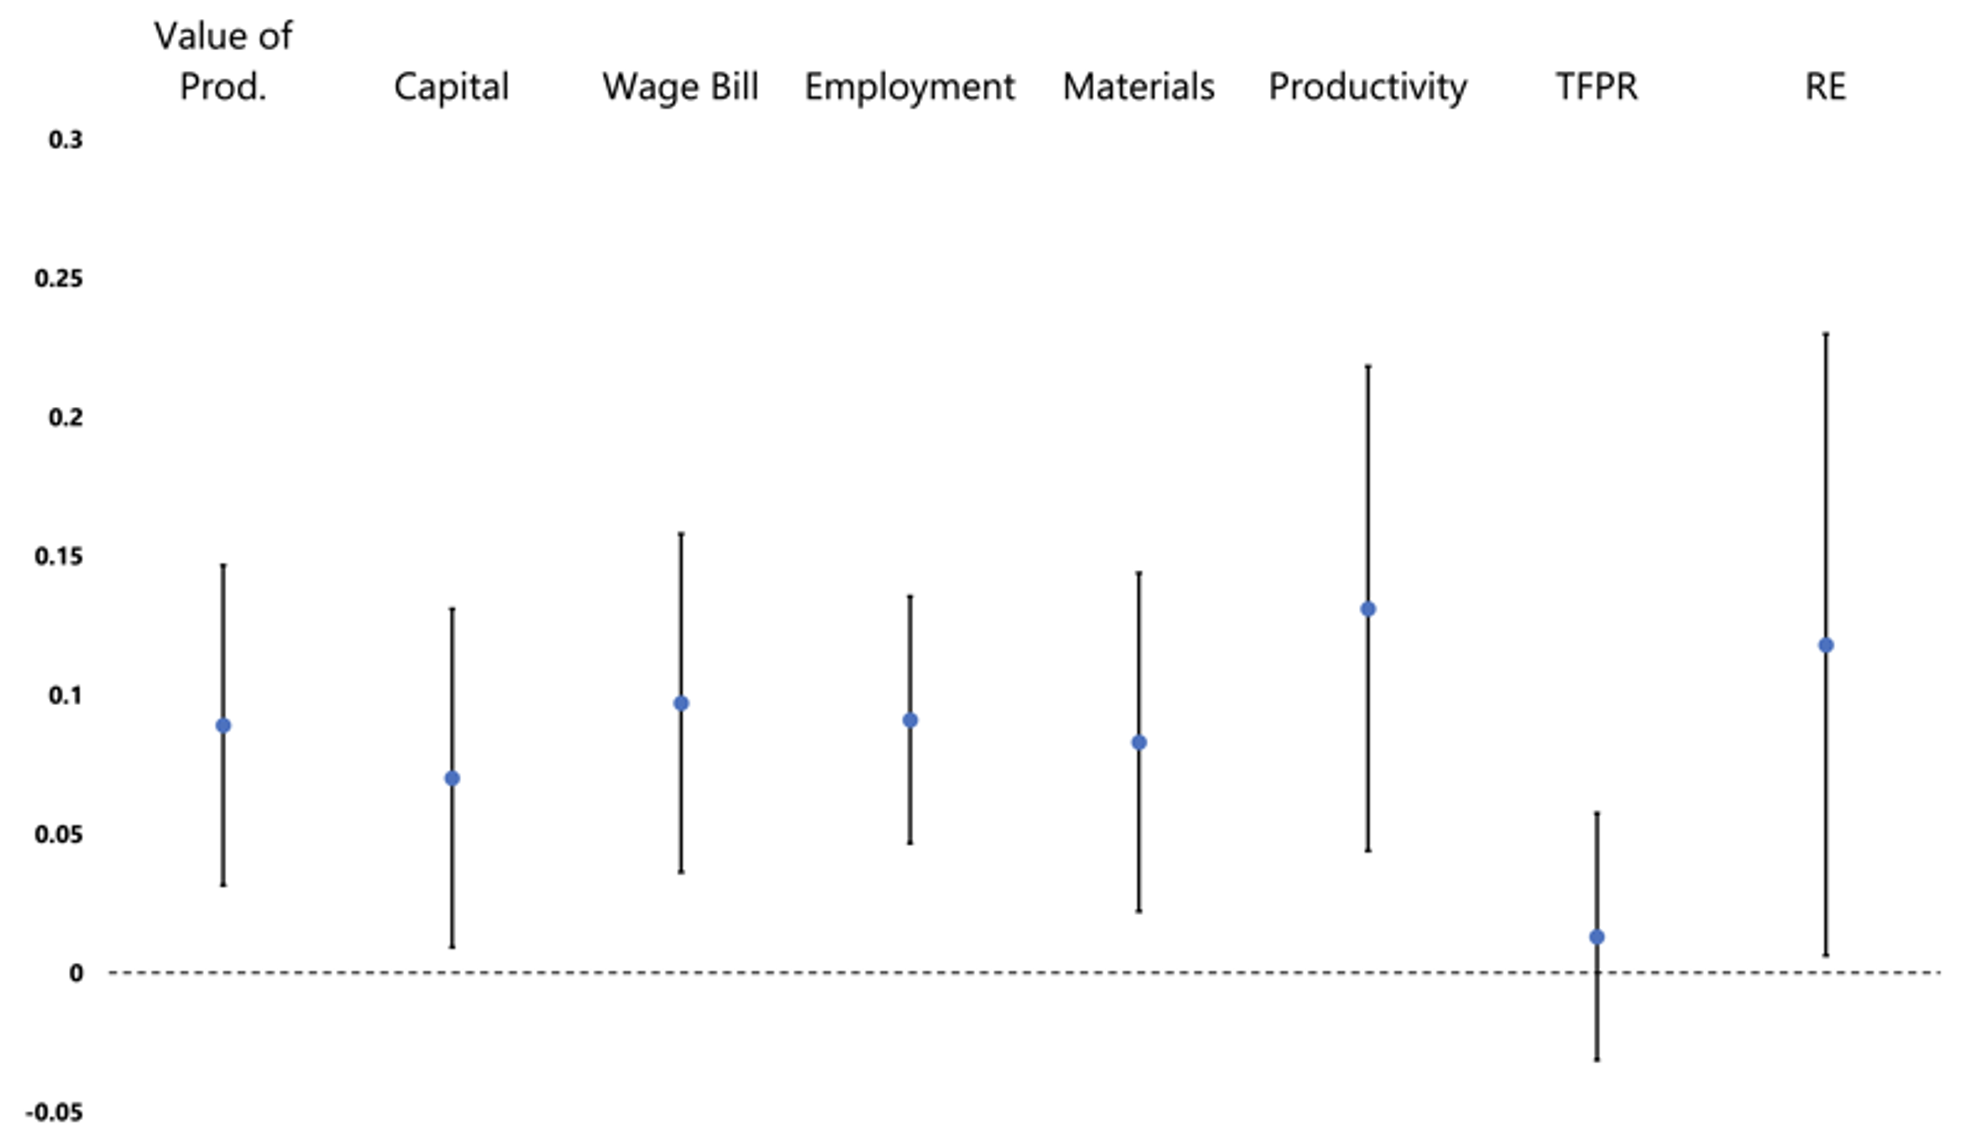
We estimate the local effects of the Panama Canal by comparing counties that gained relatively more market access with those that gained relatively less. We show that the canal’s opening led to an important expansion of the value of products, used inputs (capital, labour, materials), and productivity of the manufacturing sector of Canadian counties between 1910 and 1939. Figure 3 reports our main estimates, which are standardised in terms of the interquartile range of market access change. Moving from the 25th to the 75th percentile of gains in market access due to the canal is associated with an increase of about 9% in the value of products, capital expenditures, wage bill and employment, and materials. Productivity rose by 13%.
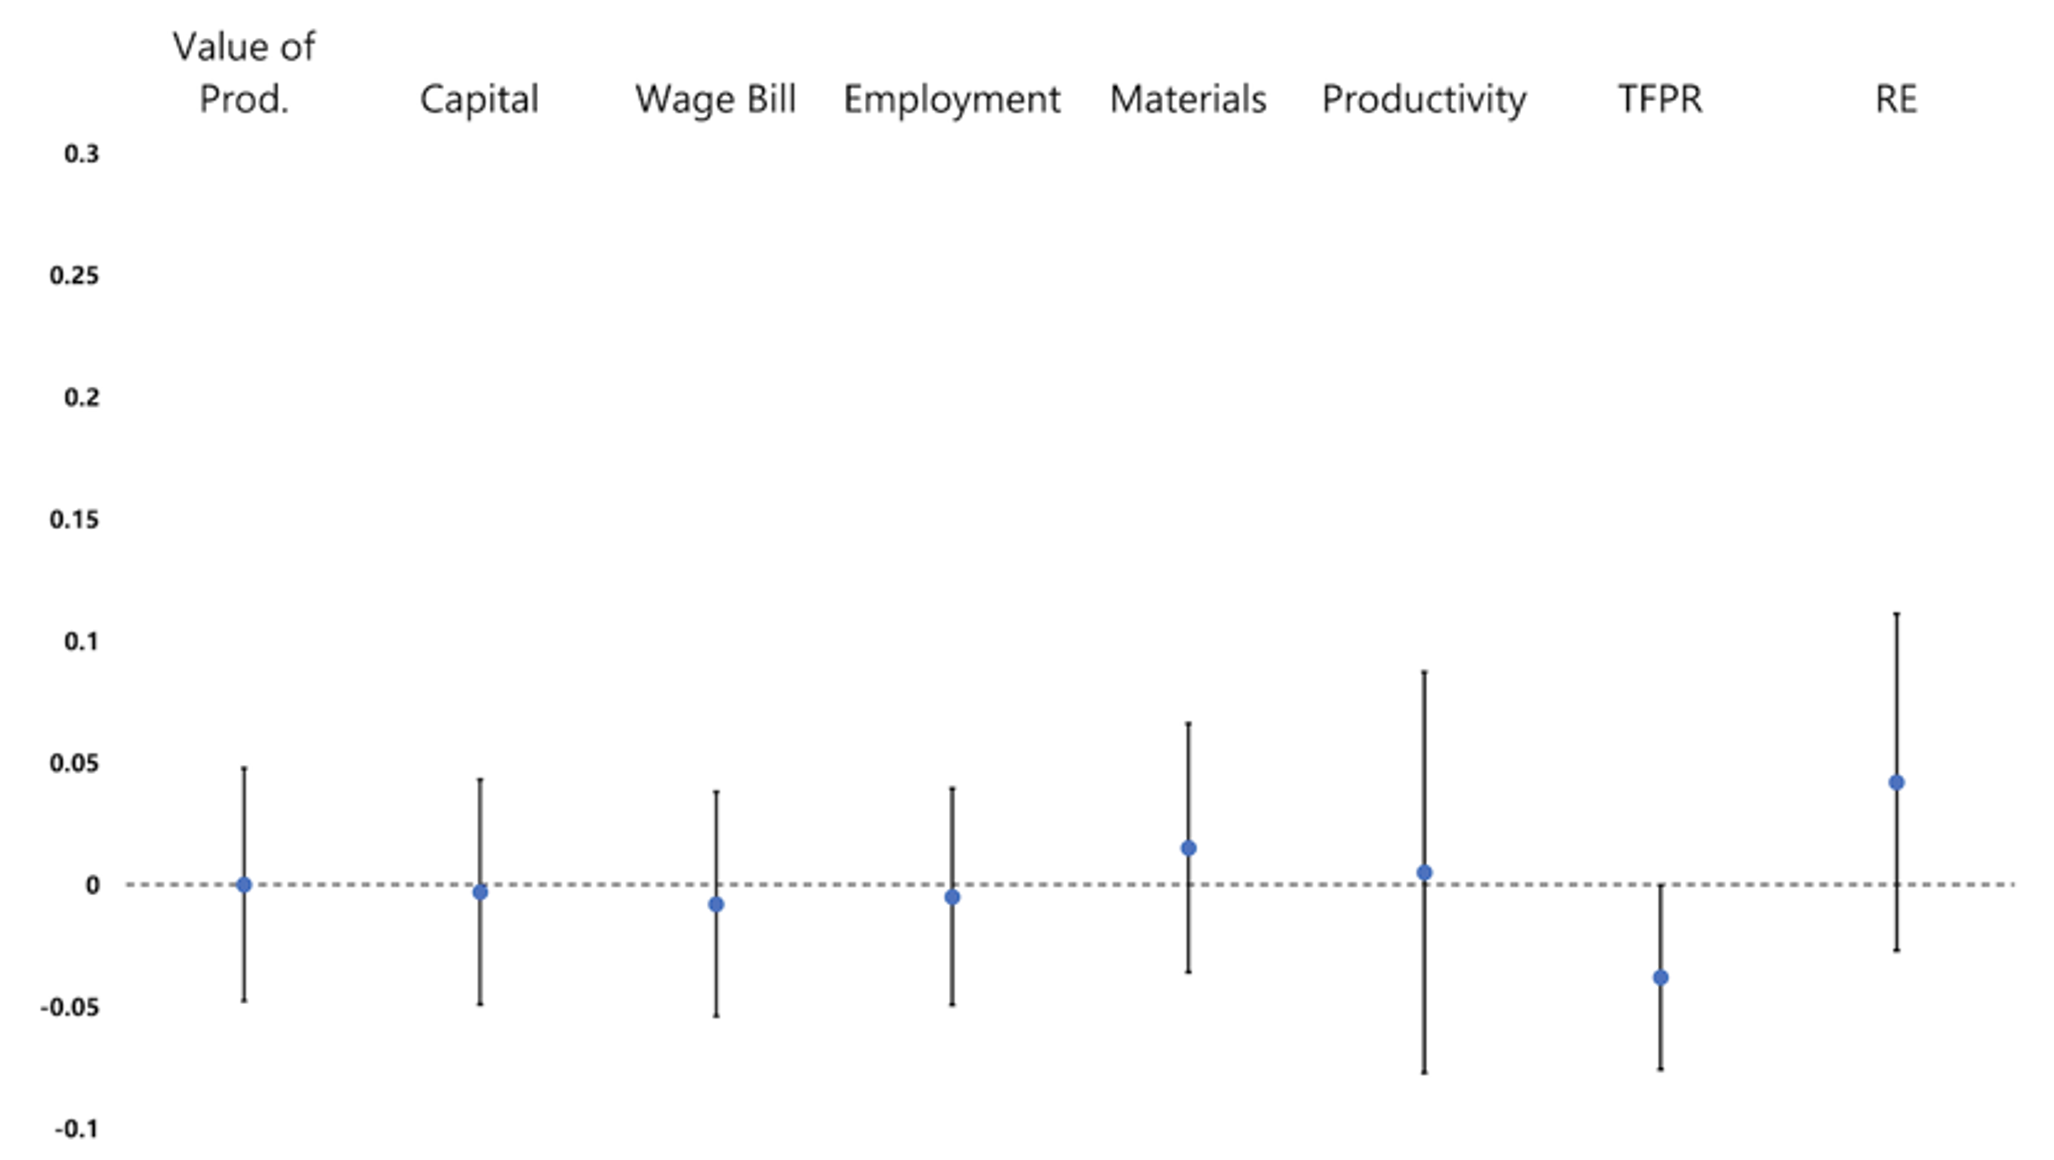
Where are the changes in productivity coming from? We find that the bulk of the productivity gains came from improvements in RE. The gains in TFPR were small and not statistically different from zero. This suggests that the canal enabled the reallocation of inputs to places where production was otherwise inefficiently low, but had little impact on the value of technical productivity.
Figure 3 Effects of increase in market access on change in manufacturing outcomes, 1910–1939
Note: Coefficients are standardised in terms of moving from the 25th to the 75th percentile of the change in market access in 1920, with and without the canal. All specifications include province fixed effects and control for a quadratic polynomial in latitude and longitude; quadratic polynomial in distance to the coast, the Great Lakes, or the St. Lawrence River; and for log population in 1910. Confidence intervals estimated from standard errors clustered at 300km x 300km cells from an arbitrary grid.
We attribute a causal interpretation to these results because, as Figure 4 shows, changes occur in all the outcomes we study from 1900 to 1910. In other words, the manufacturing sector of the places that benefitted more from the opening of the canal were not growing systematically faster than the places that benefitted less. Further, our results are robust to controlling for contemporary shocks that might act as confounders in our empirical exercise.
Figure 4 Effect of increase in market access on change in manufacturing outcomes, 1900–1910
Note: Coefficients are standardised in terms of moving from the 25th to the 75th percentile of the change in market access in 1920, with and without the canal. All specifications include province fixed effects and control for a quadratic polynomial in latitude and longitude; quadratic polynomial in distance to the coast, the Great Lakes, or the St. Lawrence River; and for log population in 1900. Confidence intervals estimated from standard errors clustered at 300km x 300km cells from an arbitrary grid.
Aggregate results
Our local-level effects do not tell us much about the aggregate impact of the canal on the Canadian economy: some counties might have expanded at the expense of others. Although the mere shifting of inputs could still imply a higher level of productivity and economic activity, we want to establish whether the canal induced a higher aggregate level of economic activity in Canada in a manner that allows for displacement and general equilibrium effects to occur.
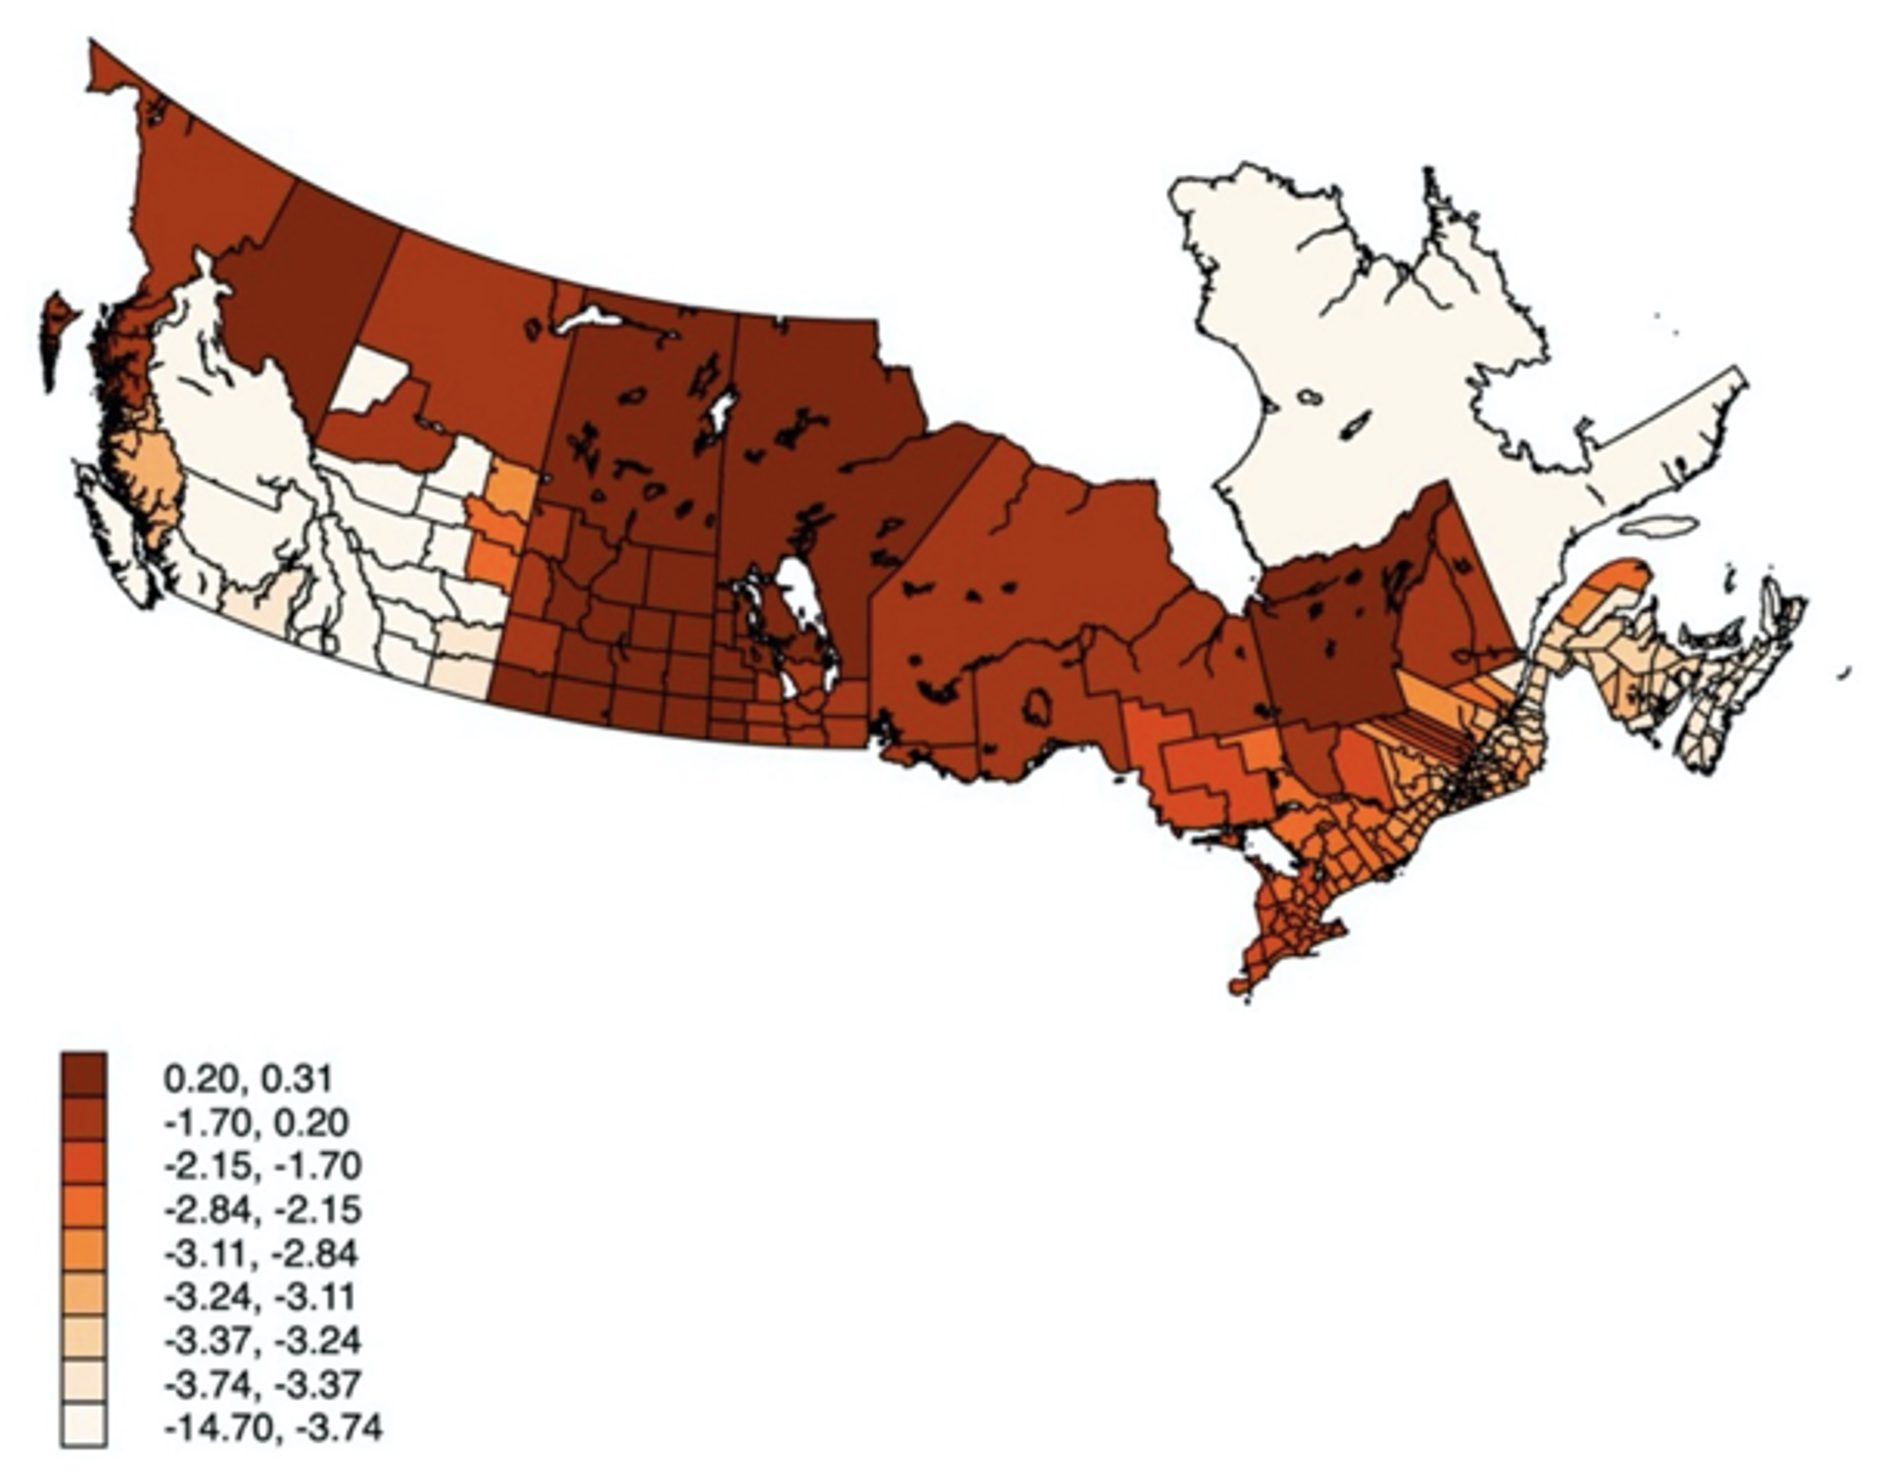
To answer this question, we calibrate an extension of a benchmark model of economic geography (Eaton and Kortum 2002, Donaldson and Hornbeck 2016, Hornbeck and Rotember 2021) and conduct a counterfactual exercise in which the Panama Canal permanently closes in 1939. We find that such an event would lead to important economic consequences for Canada. First, its total population would decrease by 2.7%. Figure 5 shows how those losses are distributed across space. The losses are concentrated in places closer to the coasts and severe in the Western provinces: British Columbia’s and Alberta’s population would have fallen, respectively, by 7.8% and 4.2%. Second, manufacturing productivity losses add up to 1.2% of the manufacturing GDP or 0.27% of Canadian GDP. These reflect lower input use across most counties. Third, land rents would have fallen by 2.6%. If land values are the present discounted value of rents, we find that closing the canal in 1939 would yield a permanent economic loss equivalent to 1.59% of GDP in the agricultural sector. When the losses in both agriculture and manufacturing are considered, we find a total loss of 1.59% + 0.27% = 1.86% of GDP had the canal closed in 1939.
Figure 5 Percentage-point changes in population in a counterfactual scenario where the Panama Canal closes in 1939
Conclusion
We find that the opening of the Panama Canal had a substantial impact on Canadian economic life and transformed the economic geography of the Western Hemisphere. First, by leveraging comparatively cheap maritime transportation, the canal paved the way for gains in market access for all Canadian counties. Thus, the Panama Canal changed the economic geography of Canada. Second, those gains drove the growth of the manufacturing sectors for counties that benefited more from the canal than others. Productivity increased, thanks mostly to improvements in re-allocative efficiency. The canal allowed a greater use of inputs in places where they yielded a higher productive use – i.e. in marginally productive counties. Third, these effects were not purely local, as they persist in general equilibrium. The calibration of a benchmark economic geography model indicates that closing the canal permanently in 1939 would have led to losses of 1.86% of Canadian GDP in 1939. Most of those losses would be attributable to decreased access to overseas markets. It turns out that there was, after all, a free ride.
References
Brancaccio, G, M Kalouptsidi and T Papageorgiou (2020), “Geography, Transportation, and Endogenous Trade Costs”, Econometrica 88(2): 657–691.
Donaldson, D and R Hornbeck (2016), “Railroads and American Economic Growth: A ‘Market Access’ Approach”, The Quarterly Journal of Economics 131(2): 799–858.
Eaton, J and S Kortum (2002), “Technology, Geography, and Trade”, Econometrica 70(5): 1741–1779.
Fajgelbaum, P and S J Redding (2014), “External Integration, Structural Transformation and Development: Evidence from Argentina 1869–1914”, VoxEU.org, 12 July.
Flückiger, M, E Hornung, M Larch, M Ludwig and A Mees (2019), “How Roman transport network connectivity shapes economic integration”, VoxEU.org, 28 August.
Galiani, S, L F Jaramillo and M Uribe-Castro (2022), “Free-Riding Yankees: Canada and the Panama Canal”, NBER working paper 30402, August.
Hornbeck, R and M Rotemberg (2021), “Railroads, Reallocation, and the Rise of American Manufacturing,” NBER Working Paper 26594.
Innis, H A (1933), Canada and the Panama Canal.
Jaworski, T, C Kitchens and S Nigai (2020), “Globalisation and the value of domestic highway infrastructure”, VoxEU.org, 1 November.
Maurer, N and C Yu (2008), “What T. R. Took: The Economic Impact of the Panama Canal, 1903–1937”, The Journal of Economic History 68(3): 686–721.
Maurer, S and F Rauch (2020), Economic Geography Aspects of the Panama Canal.
McCullough, D (1977), The Path Between the Seas: The Creation of the Panama Canal, 1870–1914, Simon and Schuster.
