Over the last three decades there has been increased polarisation in income among US communities (Austin et al. 2018), while economically vibrant cities such as New York, San Francisco, Boston, and Seattle have experienced fast increases in mean household income. At the same time, less dynamic local labour markets have experienced more limited increases in income and, in some cases, even declines (Moretti 2012). What is less clear is how the actual standard of living of residents varies across communities. The standard of living of residents of a city – which is the amount of consumption households are able to purchase – depends both on the income level that residents can expect there and the local cost of living.
While we know that large, expensive cities tend to have jobs that offer higher nominal earnings and small, affordable cities tend to have jobs that offer lower nominal earnings, we know little about where standards of living are highest. Are residents of dynamic metro areas better or worse off in terms of consumption compared to residents of smaller, economically struggling communities? This lack of information is surprising, because the amount of consumption is arguably a key component of economic wellbeing. There is limited systematic empirical evidence on the differences in consumption across cities and how they relate to local cost of living. The paucity of evidence likely reflects the lack of datasets that can measure consumption and are large enough to allow for a detailed geographical analysis.
In a new paper, we provide the first estimates of standard of living by city for households in a given income or education group and study how they relate to local cost of living (Diamond and Moretti 2021). Our main data source is a representative sample of three million US households' linked bank and credit card transactions in 2014. We use these to measure the value of consumption expenditures as we observe essentially all debit and credit card transactions, cheque and Automated Clearing House (ACH) payments, and cash withdrawals conducted every day. Our consumption data are comprehensive and include virtually all purchases conducted by individuals in our sample. We quantify how consumption in expensive cities compares with consumption in affordable cities for a given income or educational group.
To measure local prices, we build consumer price indexes that vary by city and income group. Our baseline price index is an index which mimics the index used by the US government to estimate the official national consumer price index (CPI). It is a weighted average of the local prices of items consumed by the average household with income-specific weights reflecting the importance of each item in the bundle for consumers of a given income group. Our data include all items consumed by households, from housing (the most important item) to groceries, restaurants, and other parts of the typical family budget.1
The price indexes point to large differences in cost of living across cities, especially for low-income households. The overall cost of living faced by low-income households (post-tax income less than $50,000) in the most expensive city (San Jose, CA) is 49% higher than in the median city (Cleveland) and 99% higher than in the most affordable city (Natchez, MS). By contrast, we uncover significantly smaller geographical differences for high-income households (post-tax income greater than $$200,000).
Using the prices indexes, we measure the standard of living that low- and high-skill households can expect in each US city and how it varies as a function of local prices. We focus on three skill groups, based on the schooling level of the household head: (i) four-year college or more, (ii) high school or some college, (iii) less than high school.
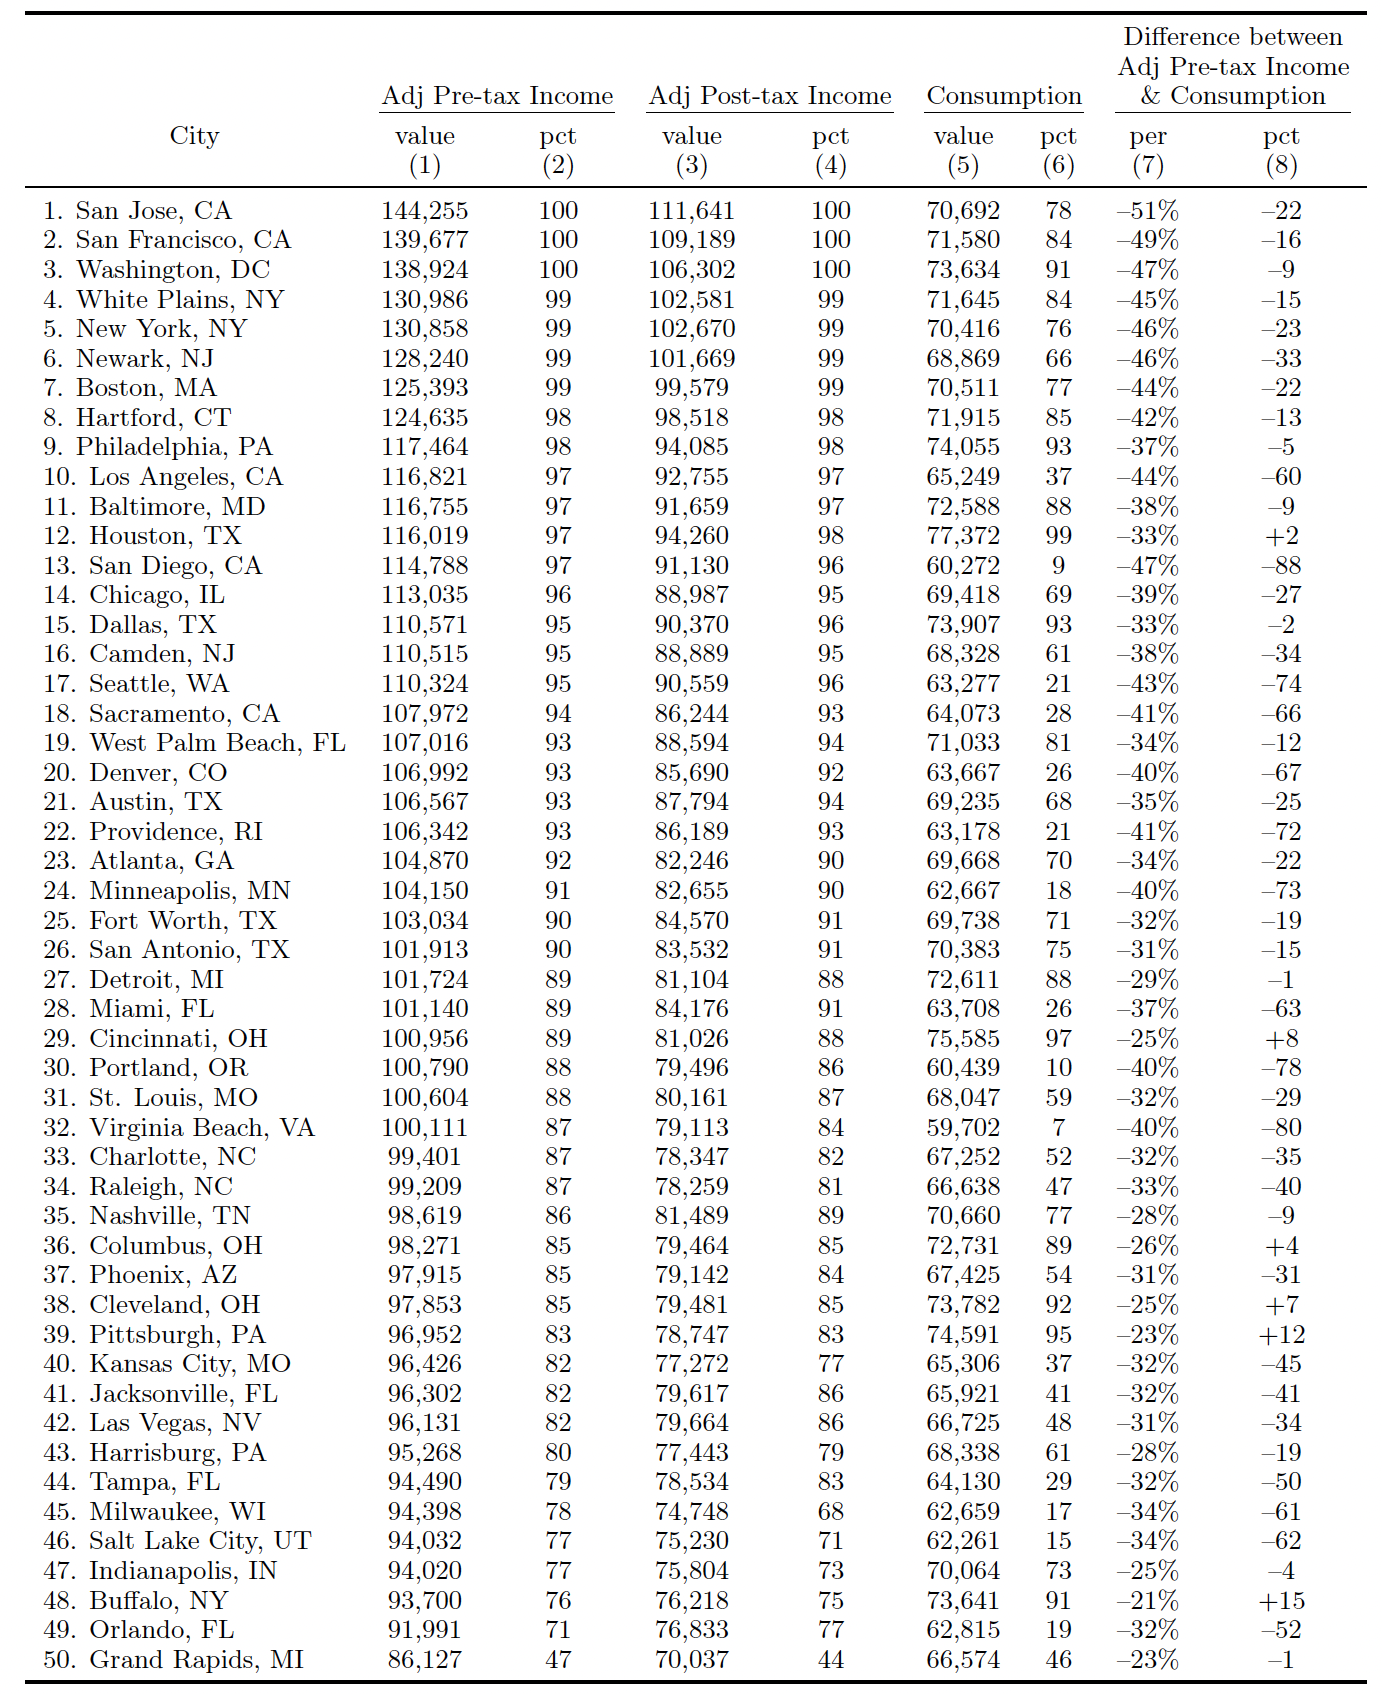
Table 1 shows our findings for households where the head has a college degree or more for the 50 largest cities in the US.
Table 1 Pre-tax income, post-tax income, and consumption: High-skill
Notes: Entries are average adjusted household pre-tax income, adjusted post-tax income, and consumption across the largest 50 commuting zones (CZs). For each variable, we report its corresponding unweighted percentile among all 443 CZs in our data.
The first three rows show that San Jose, CA, San Francisco, CA, and Washington, DC are the three cities where high-skill households have the highest expected adjusted pre-tax income, at $144,255, $139,677, and $138,924, respectively (column 1). White Plains, NY (a suburb of New York) and the city of New York itself follow closely. Column 3 reports the corresponding after-tax income obtained by subtracting personal federal and state taxes from column 1. Column 5 shows our estimates of the levels of consumption. It quantifies the standard of living that a family with this level of schooling can expect in each city. For San Jose, San Francisco, Washington DC, and New York, the corresponding values are $70,692, $71,580, $73,634, and $70,416. The entries in column 5 are substantially lower than in column 1 because high-skill residents face a particularly high local cost of living and they face high state taxes. But in terms of consumption rank, the decline for these four cities is modest. In terms of adjusted pre-tax income, these four cities are at or near the very top – their percentile is 99th or 100th, indicating that they are above most other cities (column 2). In terms of consumption, San Jose, San Francisco, Washington, and New York drop to 78th, 84th, 91st, and 76th, respectively (column 6) – still remarkably high. Thus, despite some of the highest costs of living in the US, Washington, DC, San Francisco, and New York offer a standard of living to college graduates that is higher than that offered by most other US cities.
Given the general perception of the Bay Area and New York as regions that are unaffordable even for high-skill workers, this finding may come as a surprise. While these cities are indeed incredibly expensive, they offer a before-tax nominal income level so high that even after local prices and taxes are taken into account, the standard of living of the highly educated remains higher than in most other US cities. Combining this finding with the fact that local amenities in the Bay Area and New York tend to be considered desirable by many college graduates may explain why these regions have attracted so many graduates over the past three decades.
Boston's consumption level is in the 77th percentile, while that of Chicago is in the 69th percentile. Los Angeles and San Diego experience larger drops in relative standings. In terms of pre-tax income, these two cities rank near the top, while for consumption their rank drops significantly.
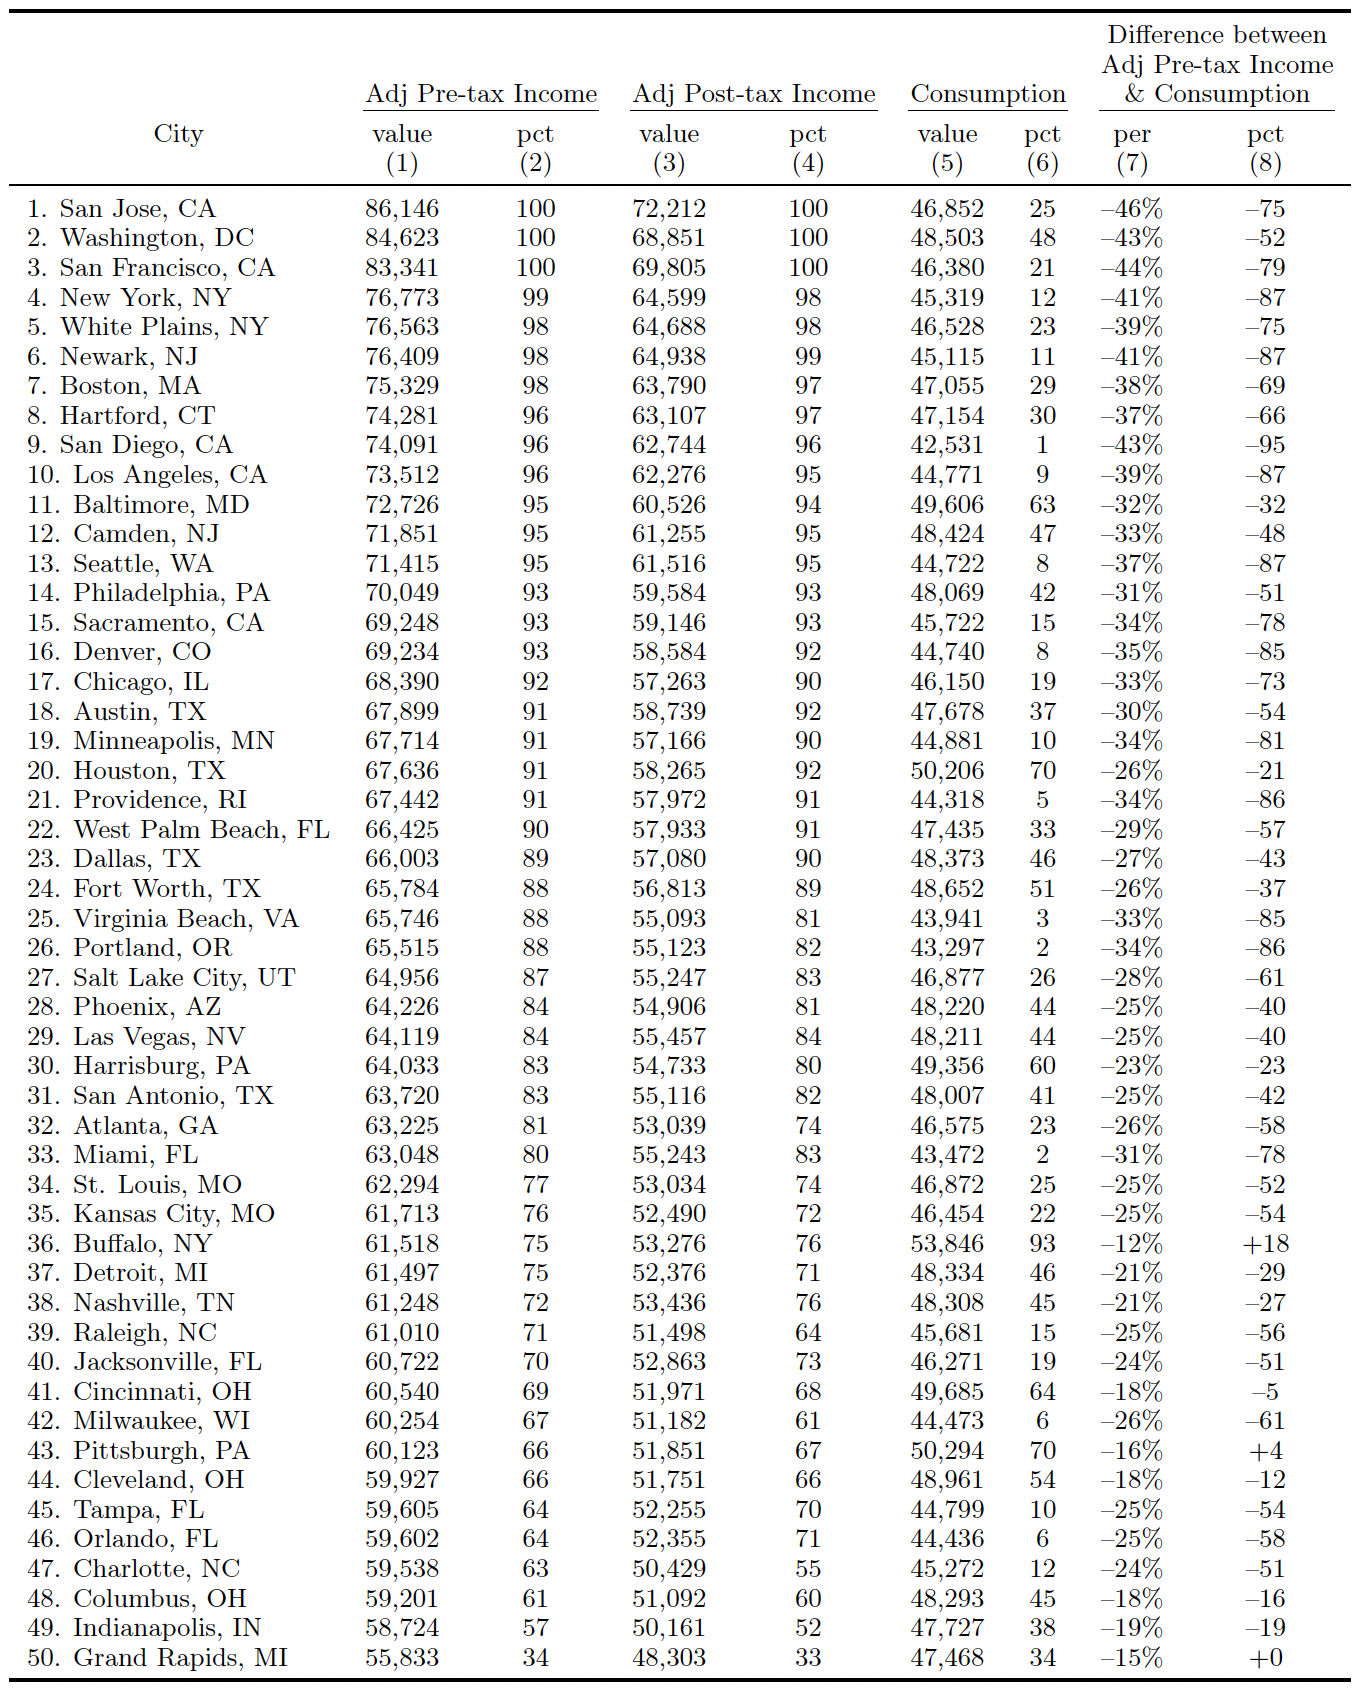
Table 2 shows households where the head has a high school degree or some college.
Table 2 Pre-tax income, post-tax income, and consumption: Middle-skill
Notes: Entries are average adjusted household pre-tax income, adjusted post-tax income, and consumption across the largest 50 commuting zones (CZs). For each variable, we report its corresponding unweighted percentile among all 443 CZs in our data.
The picture that emerges is different, in the sense that the most expensive cities appear to offer significantly lower consumption than affordable cities. For example, while in terms of adjusted pre-tax income, San Jose and San Francisco remain at the top, in terms of consumption they drop to the bottom quartile of the distribution. New York, Boston, and Chicago are in the 12th, 29th, and 19th percentiles, respectively. Los Angeles, San Diego, and Seattle are in the bottom 10% of the consumption distribution. Overall, it seems that while nominal pre-tax incomes are higher in expensive cities for this group, they are not high enough to offset the high costs of living.
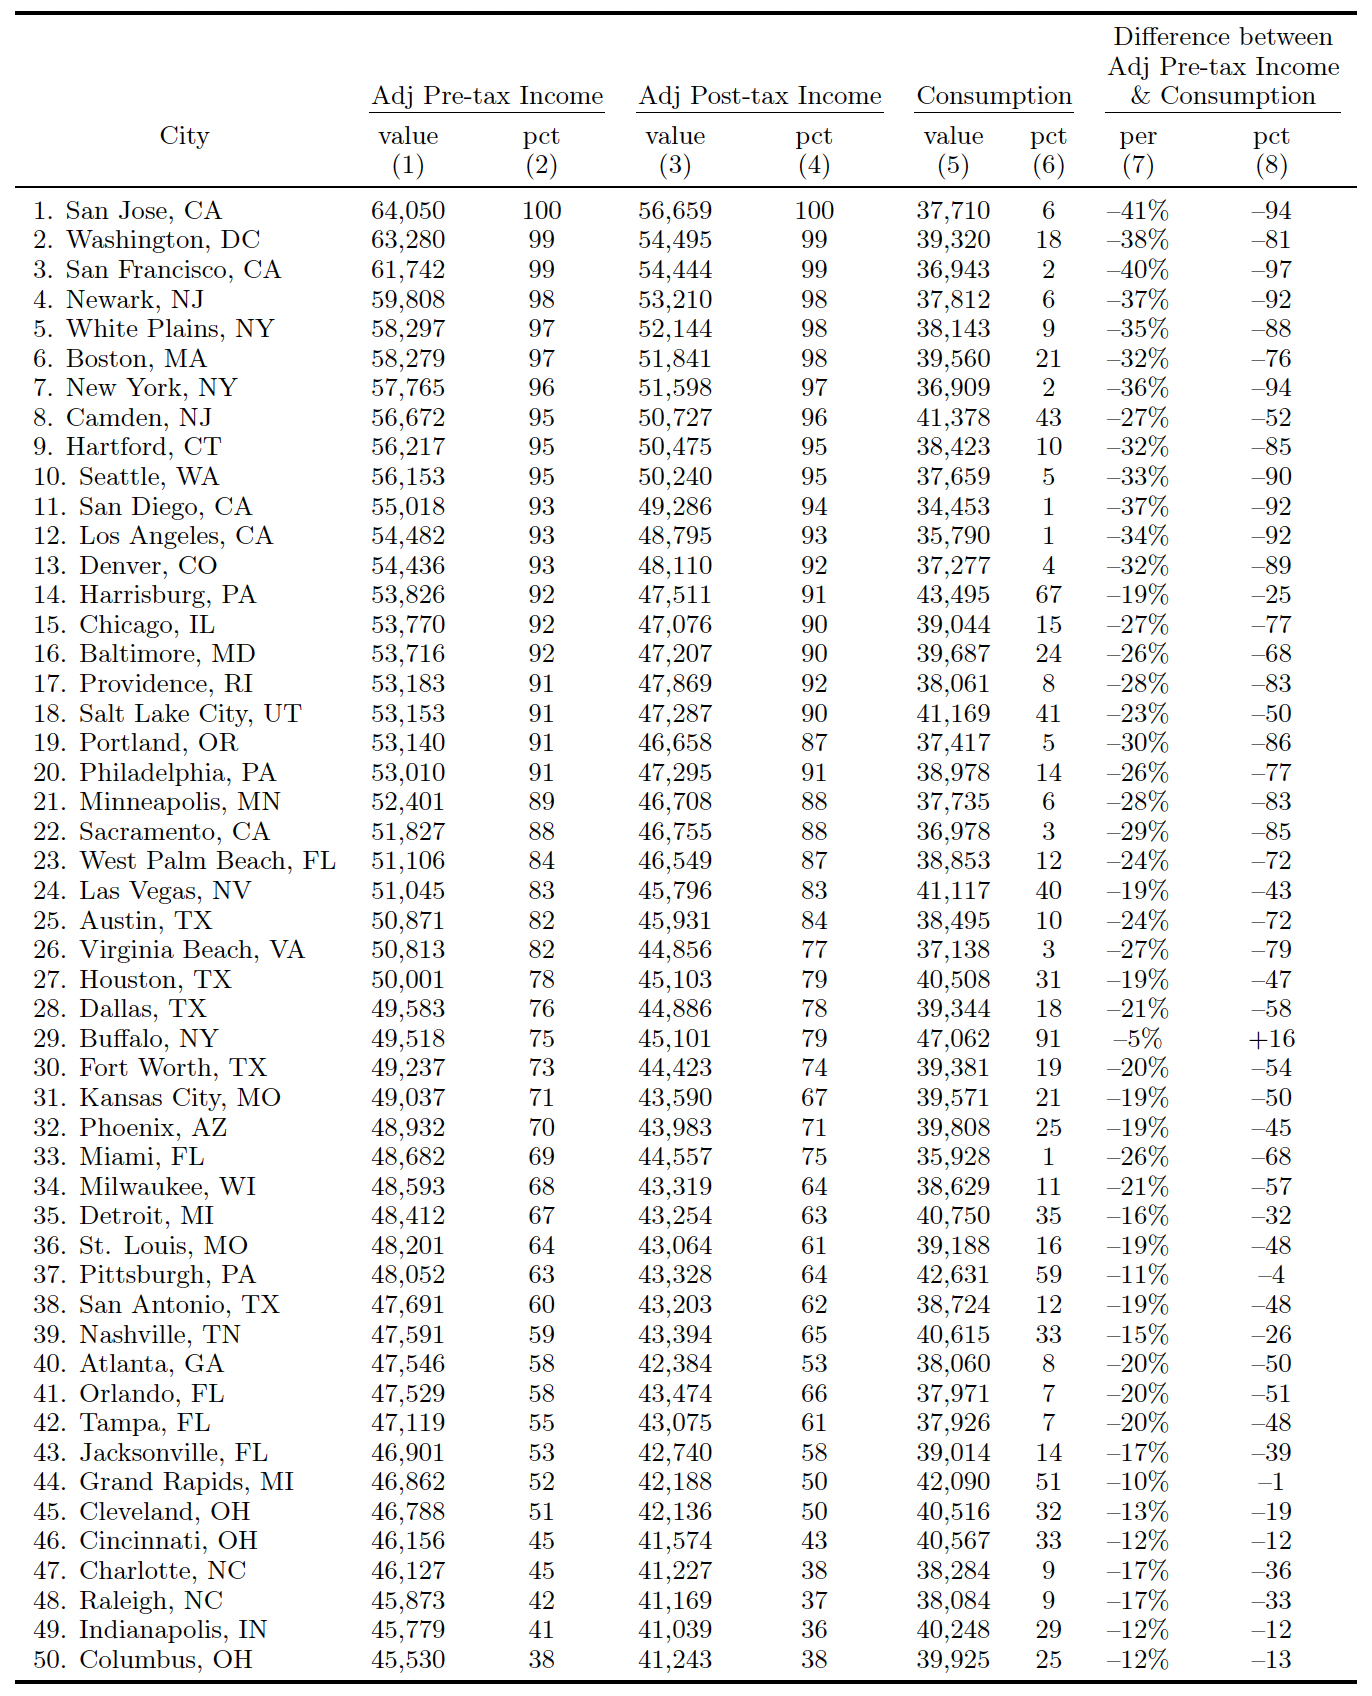
Table 3 shows that local prices in high-cost cities take an even larger toll on the consumption of households where the head has less than a high school education. For example, the consumption of high school drop-outs in San Francisco, New York, Denver, and Los Angeles is in the bottom 10% of the distribution. In these cities, adjusted pre-tax nominal salaries are higher than in most other cities, but the cost of living is so high that low-skill residents' standard of living is among the lowest in the nation. Boston and Philadelphia fare slightly better, although their consumption remains in the bottom quartile of the distribution.
Table 3 Pre-tax income, post-tax income, and consumption: Low-skill
Notes: Entries are average adjusted household pre-tax income, adjusted post-tax income, and consumption across the largest 50 commuting zones (CZs). For each variable, we report its corresponding unweighted percentile among all 443 CZs in our data.
Overall, when we study the relationship between standard of living and cost of living across all the cities in the US, we find that it really depends on the level of schooling. For college graduates, there is no significant relationship between consumption and cost of living. We find that college graduates located in cities with a high cost of living enjoy an expected standard of living similar to college graduates with the same observable characteristics located in cities with a low cost of living. The reason is that for skilled households, expensive cities offer pre-tax incomes high enough to exactly offset the higher cost of living and personal taxes.
For less-skilled households, the picture that emerges is markedly different. San Francisco, New York, and Boston offer high pre-tax incomes to high school graduates, but not high enough to offset the cost of living and taxes. On net, the standard of living of middle-skill households in these three cities is in the bottom third of the distribution. The relationship between consumption by high school graduates and the local price index is negative, confirming that expensive cities offer a standard of living that is systematically below that of affordable cities. Our estimates imply that a middle-skill household moving from the median city (Cleveland) to the city with the highest price index (San Jose) would experience a 7.7% decline in their standard of living. Moving from the city with the lowest cost of living index (Natchez) to the city with the highest index would imply a decline in the standard of living by 12.7%.
The negative relationship between consumption and cost of living is significantly steeper for high school drop-outs. For this group, the standard of living in expensive cities is quantitatively much lower than in cheaper cities. For households in this group, moving from Cleveland to San Jose implies a 15.6% decline in the standard of living, while moving from Natchez to San Jose implies a 26.9% decline in the standard of living.
We also find that consumption inequality within a city increases significantly with the cost of living. In particular, we find that the difference in standard of living between high- and low-skill households in the same city is much greater in expensive cities than in affordable cities. (Eeckhout et al. 2021) This finding appears to validate the growing concerns in expensive cities about the declining standard of living of less-skilled residents, who in recent decades have been exposed to increasingly affluent co-residents and higher local prices, raising questions about affordability and gentrification (Causa et al. 2021)
References
Causa, O, M C Cavalleri, M Abendschein, and N Luu (2021), “The laws of attraction: Economic drivers of inter-regional migration, the role of housing, and public policies”, VoxEU.org, 11 December.
R Diamond and E Moretti (2021), “Where is standard of living the highest? Local prices and the geography of consumption”, NBER Working Paper 29533.
Eeckhout, J, C Hedtrich, and R Pinheiro (2021), “Inequality is an urban affair, and it’s due to new tech”, VoxEU.org, 16 October.
Austin, B, E Glaeser, and L Summers (2018), “Jobs for the heartland: Place-based policies in 21st century America”, Brookings Papers on Economic Activity 151-232.
Handbury, J (2019), “Are poor cities cheap for everyone? Non-homotheticity and the cost of living across US cities”, NBER Working Paper 26574.
Handbury, J and D E Weinstein (2015), “Goods prices and availability in cities”, Review of Economic Studies 82: 258–296.
Moretti, E (2012), The new geography of jobs, Houghton Mifflin Harcourt.
Endnotes
1 We also examine six alternative price indices based on alternative assumptions, including ones that correct for differences in variety and supply across cities (Handbury and Weinstein 2015, Handbury 2019).


