Since the 1980s, regional economic inequality has been rising in most industrialised economies (Wolf and Rosés 2018). The UK stands out for how far this has developed: by the 2010s, the UK had become one of the most regionally unequal of the world’s industrialised economies in terms of GDP per capita, productivity, and disposable income (McCann 2020), driven in large part by its exceptionally rapid deindustrialisation and the rise of finance and business services.
This has come alongside rising regional inequalities in life expectancy and educational attainment (Farquharson et al. 2022, Marmot 2020); political instability and a ‘geography of discontent’ (Poelman et al. 2019, McCann 2020, Rodríguez-Pose 2018); and low national productivity growth (Ilzetzki 2020). The scale and persistence of these regional inequalities have generated a major national policy debate about how to ‘level up’ the UK’s lagging regions (e.g. Ilzetzki 2022, Rodríguez-Pose et al. 2018).
We contribute to this debate with our new paper (Stansbury et al. 2023), which sketches how the UK ended up in this position, and provides new analysis identifying the most promising areas for policy interventions to boost productivity in the UK’s lagging regions.
How did we get here? Post-industrial regional economies trapped in a bad equilibrium
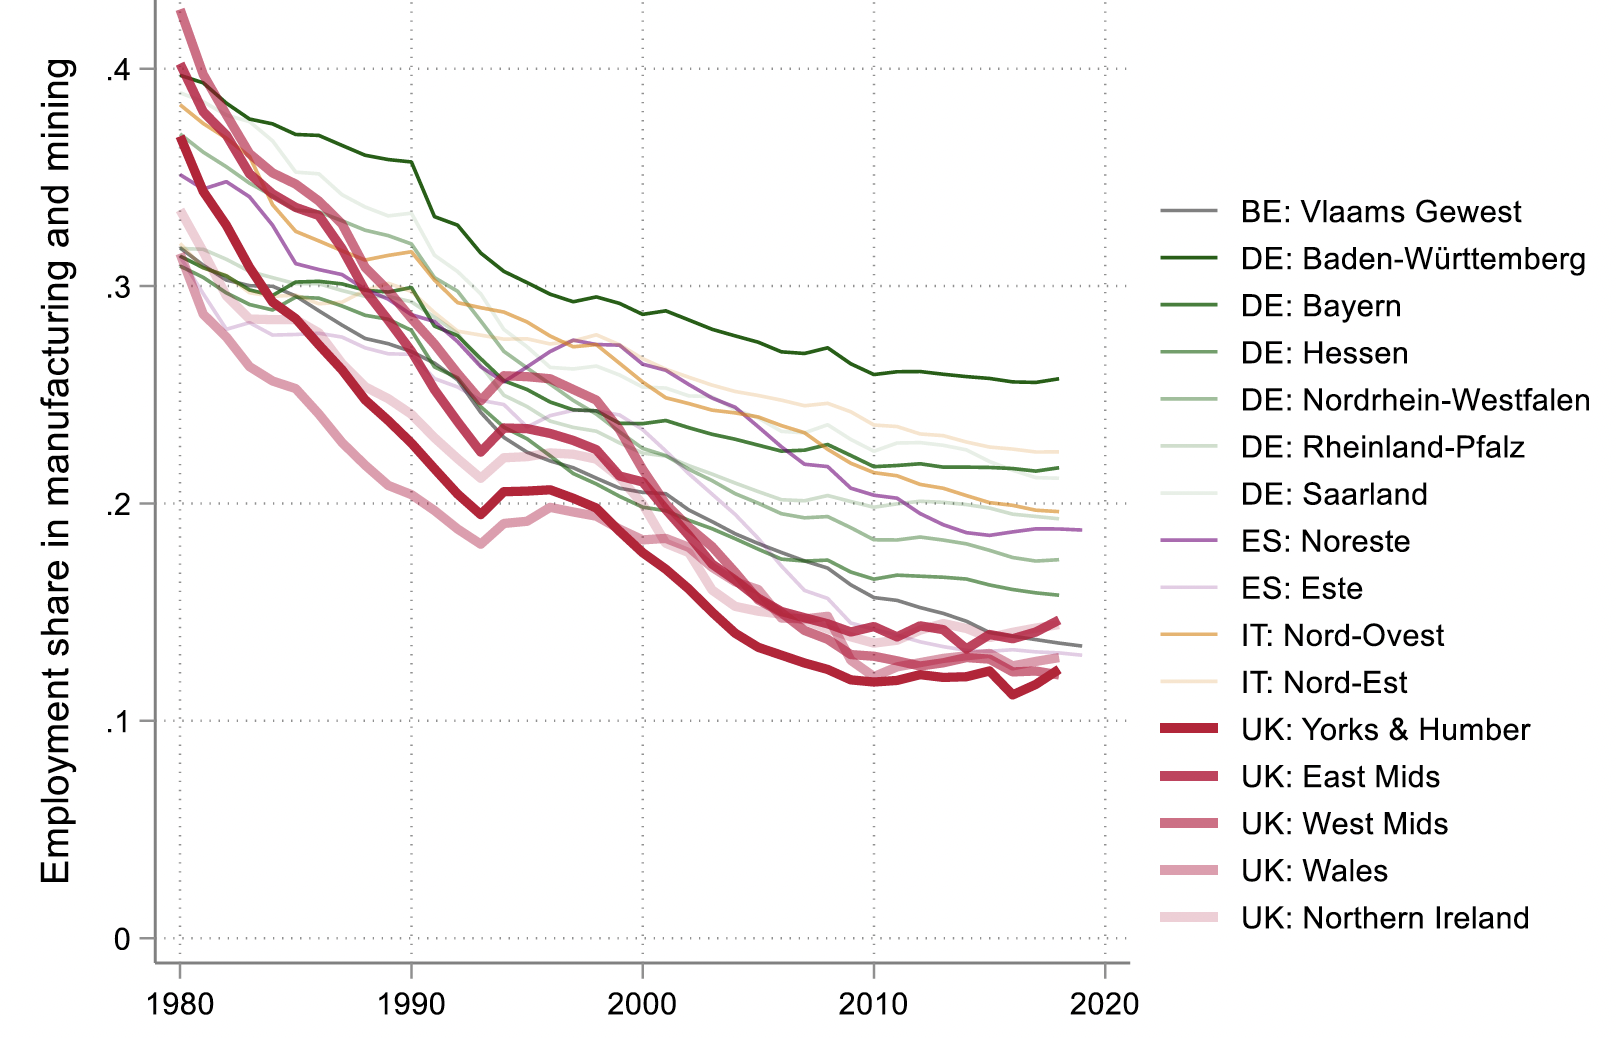
Deindustrialisation went further and faster in the UK than in Western Europe's other most-industrialised regions, with waves of particularly rapid deindustrialisation in the 1980s and 2000s (Figure 1). At the same time, London has seen a take-off of growth since the 1980s, driven by finance and business services (Ehrlich and Overman 2020). Unlike in the US, the key driver of the UK’s regional differences in income per capita is productivity, as employment differentials across regions have converged over time. And unlike several countries, the UK’s regional inequality story is not one of ‘cities versus the rest’; in fact, outside London, UK cities have low productivity for their size and do not appear to benefit from the agglomeration economies seen elsewhere (Özgüzel 2020a, Forth 2017, OECD 2015).
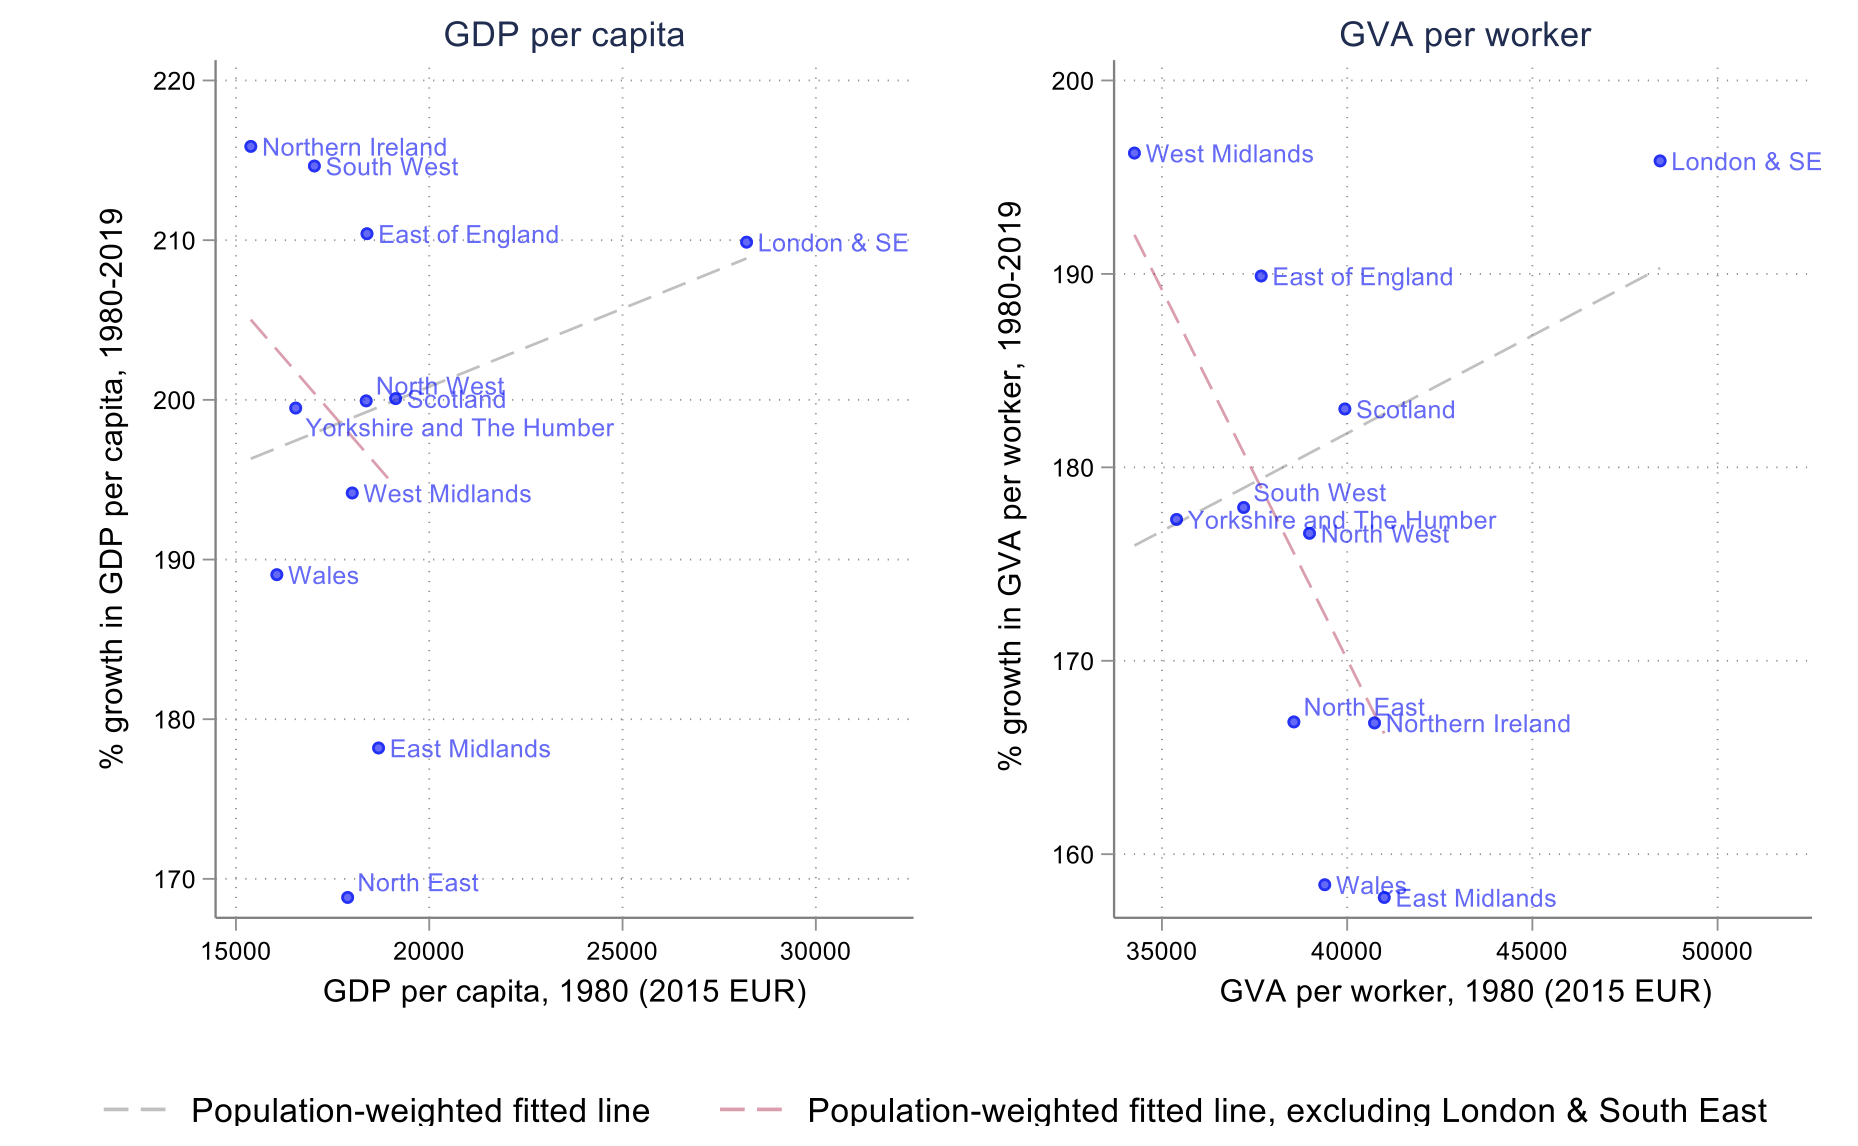
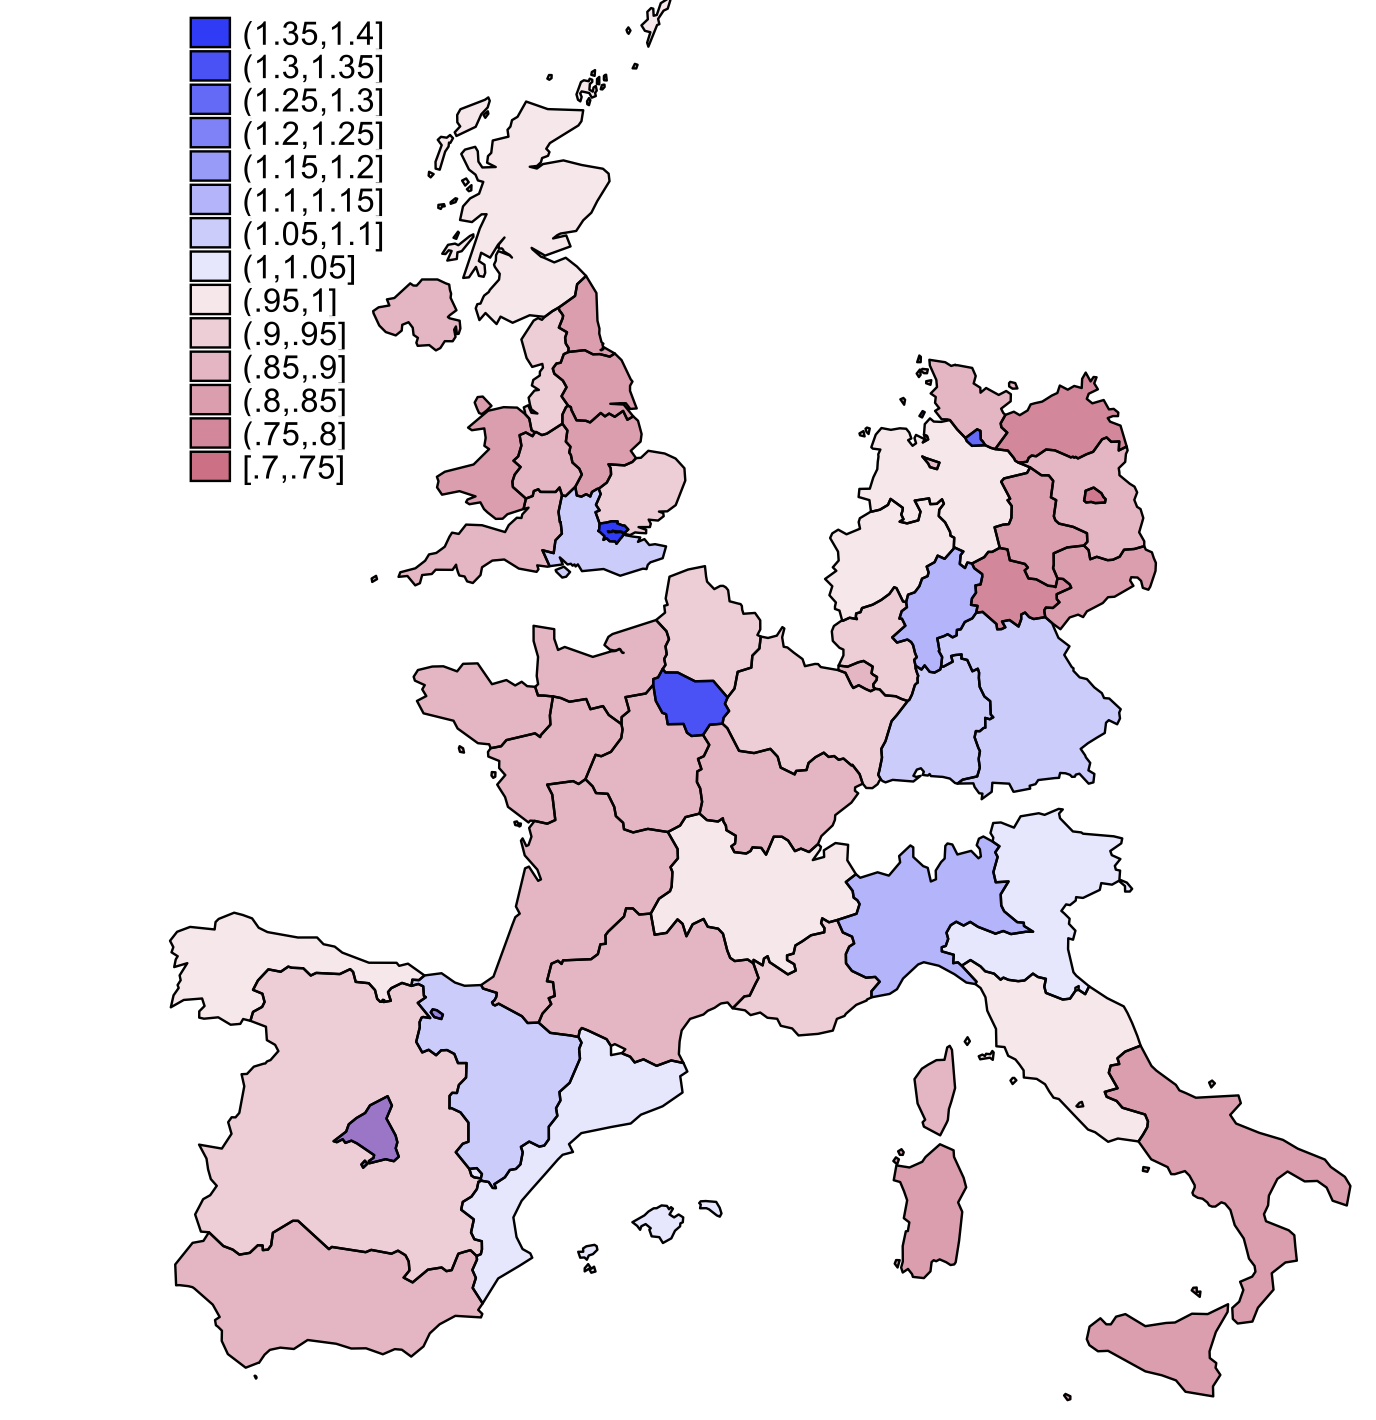
As a result, the UK’s regional economic inequality is best characterised by large productivity disparities between London and the South East versus the rest of the country (Figure 2, see also McCann 2020, Carrascal-Incera et al. 2020, Harris and Moffat 2022). The gap between London and the South East versus the rest of the UK is now larger than the gap between East and West Germany, or North and South Italy (Figure 3).
Figure 1 UK regions deindustrialised much faster than Western European peer regions
Employment share in manufacturing and mining in Western Europe’s most industrial regions, 1980-2019
Source: ARDECO.
Note: Figure shows the 16 Western European regions which had the highest employment share in manufacturing and mining in 1980.
Figure 2 UK regional inequality is largely a story of London and the South East pulling away from other regions
Growth in GDP per capita and GVA per worker, 1980-2019, UK regions
Source: ARDECO
Figure 3 The productivity gap between London and the South East versus the rest is comparable to the gap between East and West Germany, or North and South Italy
GVA per worker relative to national average, 2019
Source: ARDECO; Authors’ calculations.
Note: Regions are red if GVA per worker is below the national level and blue if GVA per worker is above the national level.
Is there anything we can do to break this cycle and build stronger regional economies?
Economic theory identifies four important ingredients with which government policy can boost productivity growth: education, infrastructure, support for Research and Development (R&D), and access to finance.
We analyse each of these in turn, asking: in which of these areas could policy boost growth most effectively? For each of these, we attempt to identify not just whether and to what degree the ingredient for productivity growth is present, but also whether or not that ingredient is in relative shortage in each region as compared to its demand – whether it is a particularly binding constraint on growth (in the spirit of the growth diagnostic approach developed by Hausmann et al. 2008). Identification of which constraints are more or less binding is crucial for effective policy interventions. Since there are likely a large number of factors associated with growth which are lacking, and a large number of possible models through which to interpret a region’s growth problem and possible remedies to fix it, identification of which policy interventions will be most effective requires identifying not just a laundry list of all the factors that are lacking, but also a diagnosis of which of these constraints are the most binding – and a policy intervention to increase a region’s supply of an input which is not a binding constraint will fail to generate productivity growth in that region unless the other binding constraints are also alleviated at the same time.
Education: From too few graduates in the 1990s to too few scientists today
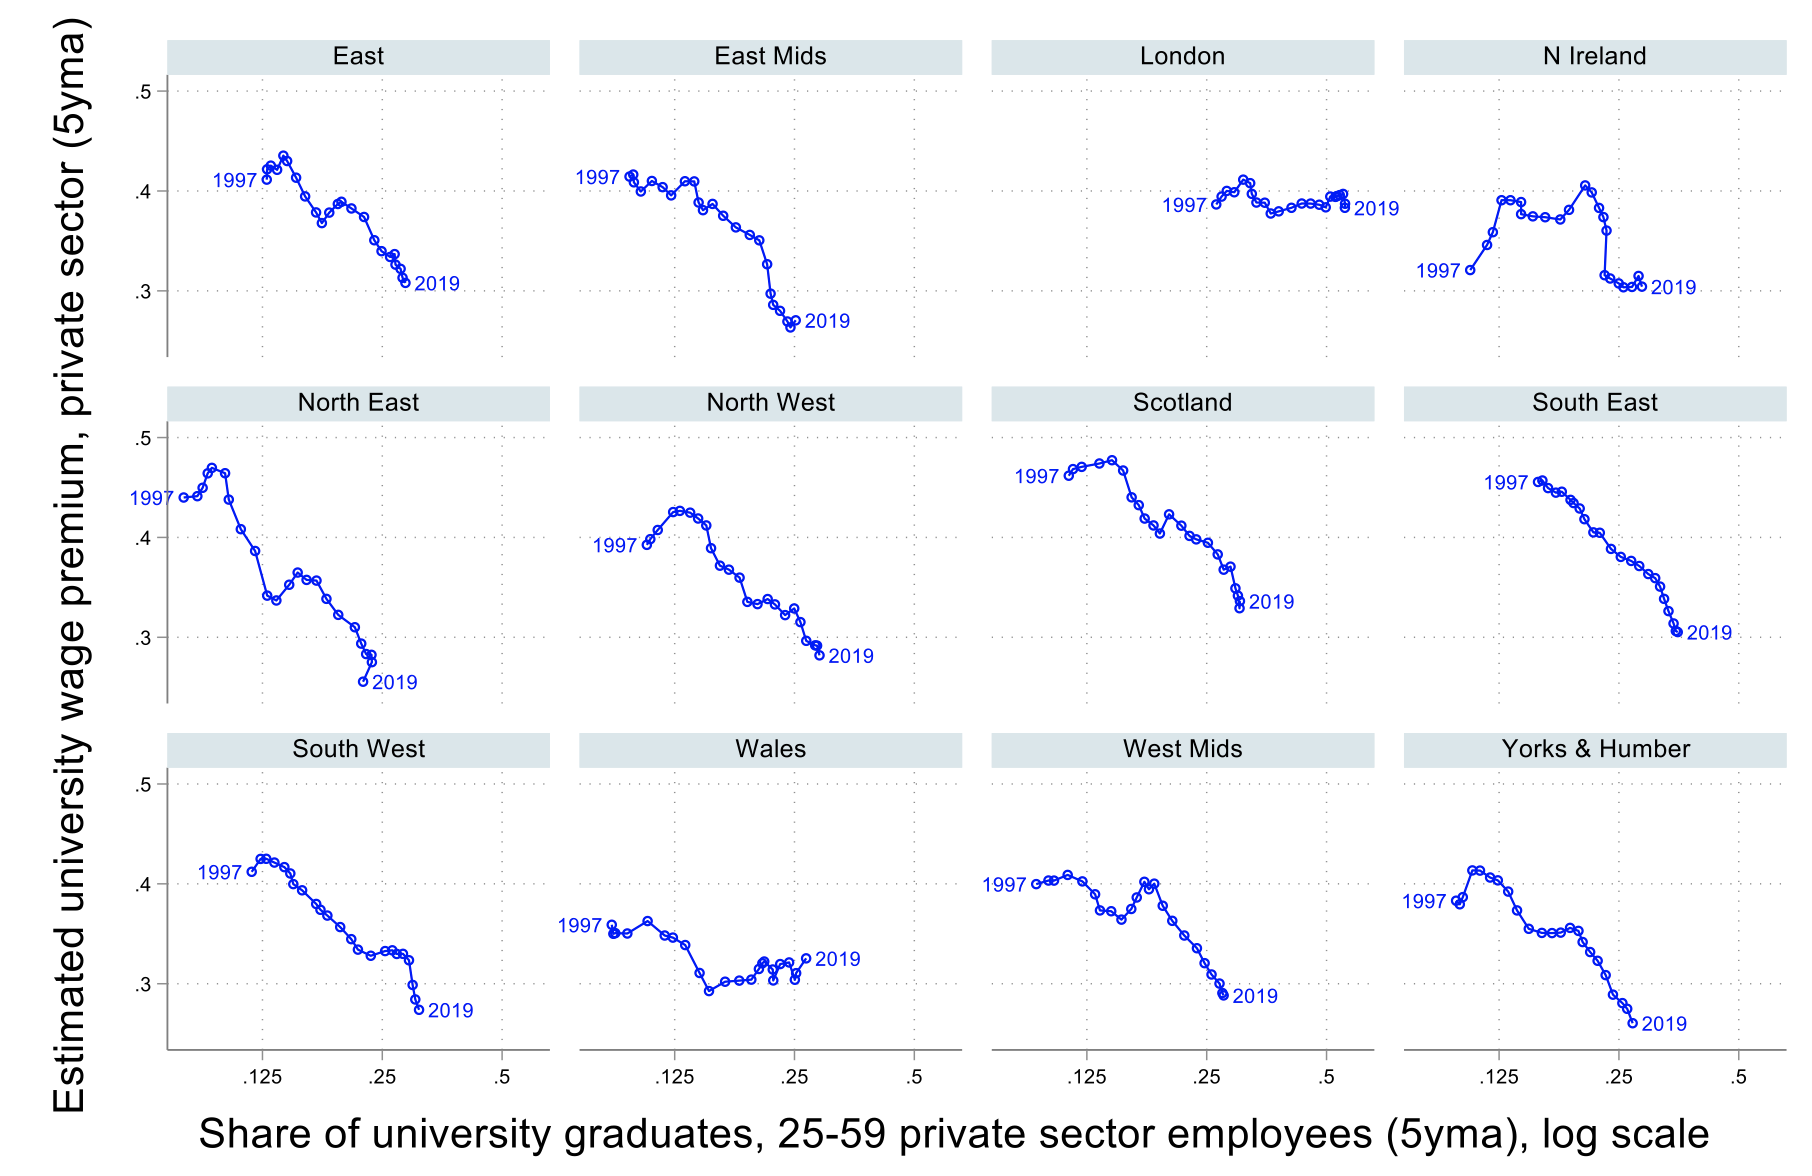
Human capital is a key input in modern economic activity, and the UK’s lower productivity regions have lower levels of education among the workforce. But a low level of education among the population may be an outcome of low growth in a region, rather than a cause of it. To test whether a lack of human capital is a key bottleneck to growth in the UK’s non-London regions, we therefore estimate the university wage premium – the wage premium someone can expect to earn as a graduate relative to non-graduates – in each region over time (following Goldin and Katz 2008). We can interpret the university wage premium as a measure of the relative scarcity of university graduates in the workforce: a high university wage premium means firms are willing to pay a lot for a university graduate, suggesting their skills are in high demand relative to supply, and vice versa.
Figure 4 University wage premia have fallen in all regions outside London as university attainment has risen, suggesting that rising supply has outstripped demand for graduates
University wage premia across regions, 1997-2019
Source: Analysis of UK Labour Force Survey.
Note: “5yma” refers to five year moving average. Each point is the estimated wage premium for university graduates relative to A-level recipients, and the share of university graduates among private sector employees in a region in each year 1997-2019.
We find that in all regions except for London, the university wage premium has fallen dramatically over the past twenty years – a success of the policy-driven expansion of higher education – and is now substantially higher in London than outside London (Figure 4). The exception to this trend is STEM subjects, where we find that the wage premium has fallen little; in fact, STEM degrees have now come to command a higher premium than degrees like law or finance that were previously in high demand. This evidence suggests that in the past, a lack of university graduates may have been a bottleneck to growth outside London – but now, the more binding constraint is not a lack of university graduates in general but a lack of STEM-trained graduates in particular.
What’s more, in the context of free labour mobility, we caution that increasing enrolment alone cannot be the solution. Net graduate outmigration from even low-enrolment regions suggests that the dominant problem for most regions is a lack of demand for graduates, more than a lack of supply of graduates.
Infrastructure: Too little transport investment in lower productivity regions
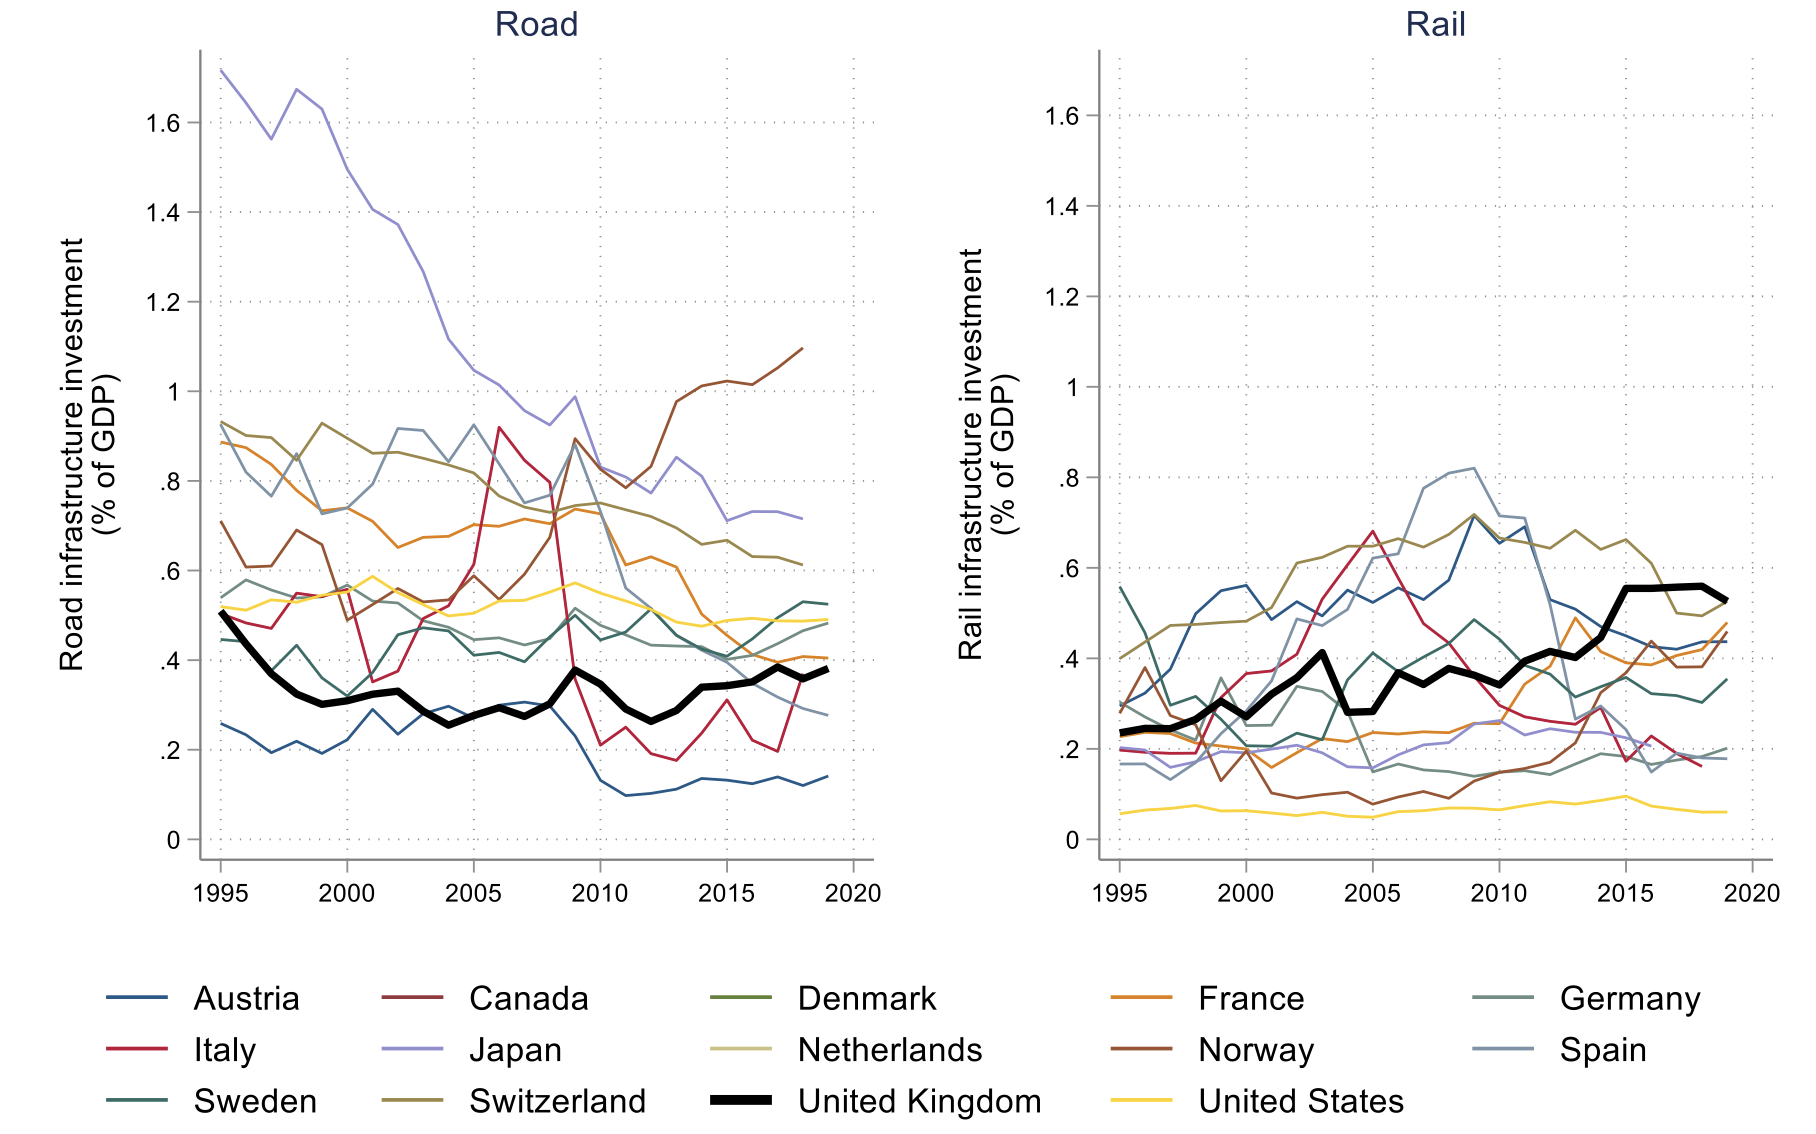
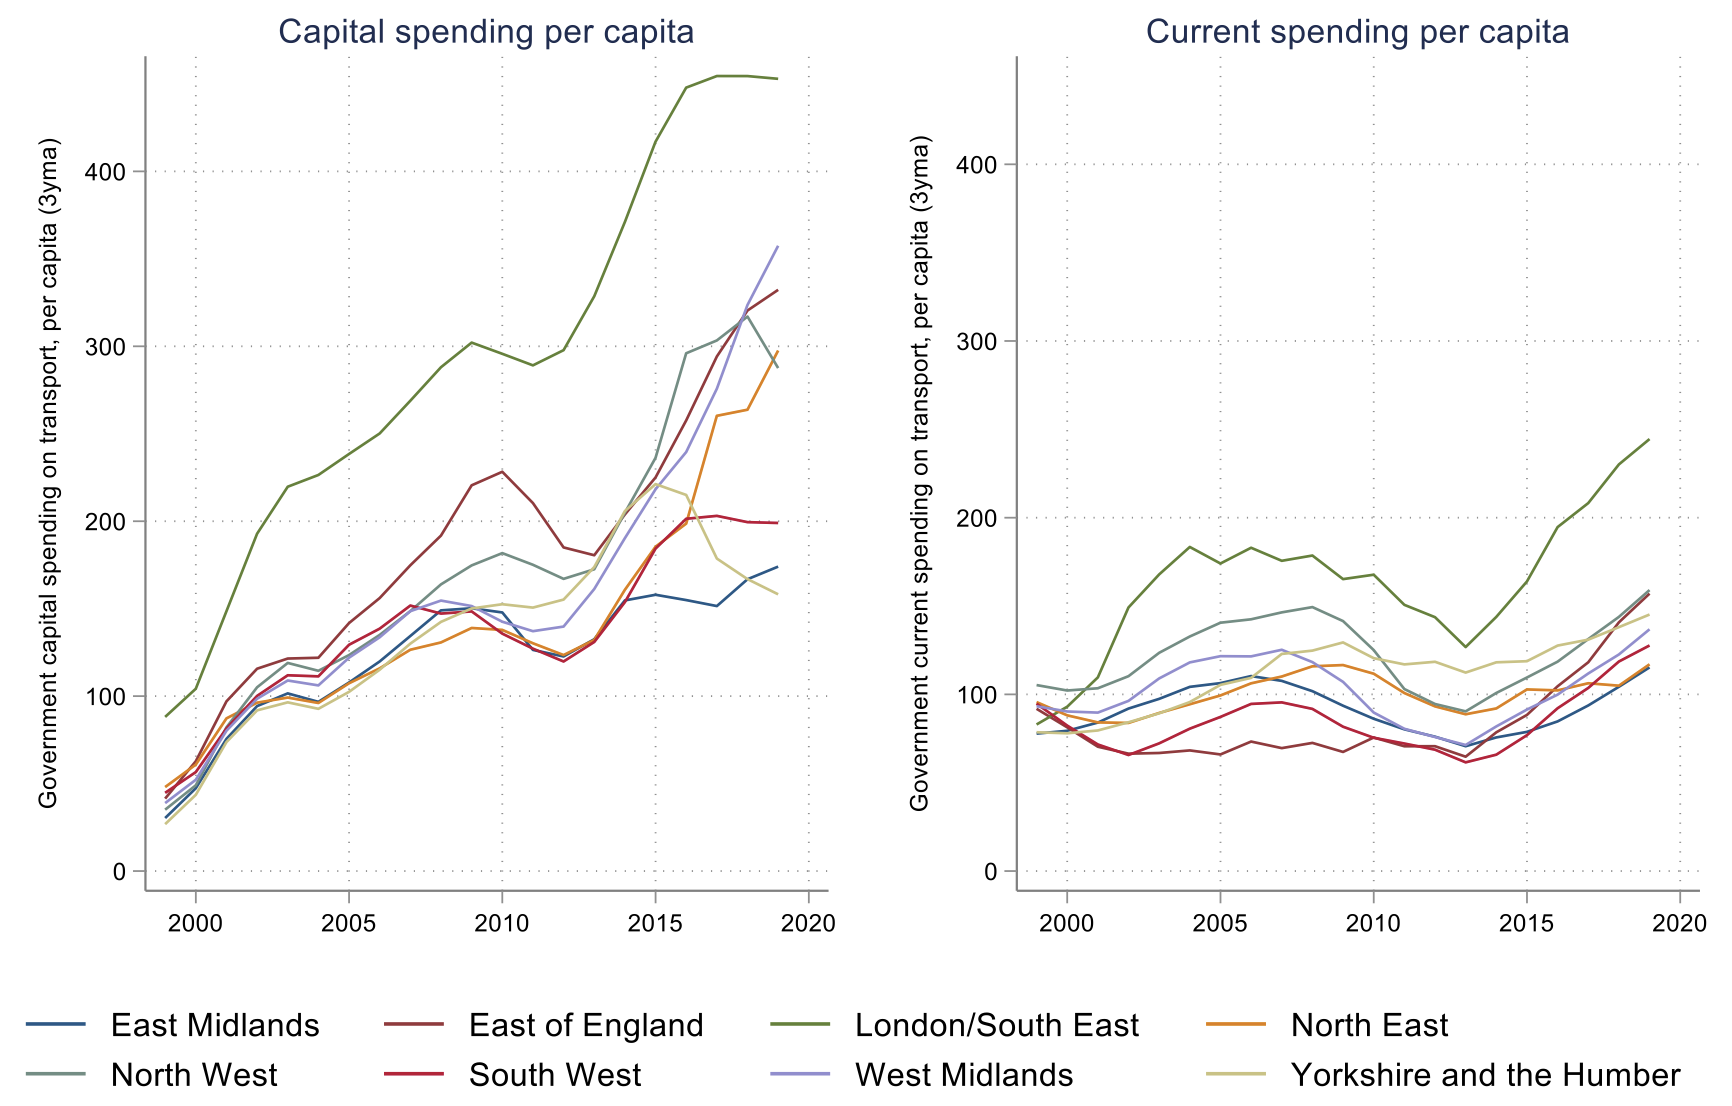
Another crucial determinant of a region’s productivity is agglomeration effects: increasing the effective size of city-regions with good transport infrastructure allows for more frequent, lower cost interaction between people, and larger pools of workers and customers for firms (Graham and Gibbons 2019, Özgüzel 2020b; Rice et al. 2006, Sanchis-Guarner et al. 2017). The UK has spent relatively little on transport infrastructure in recent decades – and among the lowest of any OECD country on roads (Figure 5). What money has been spent, including a recent surge in rail spending, has gone disproportionately to London and the South East (Figure 6).
Figure 5 UK road investment is particularly low in international context
Transport investment as a share of GDP across countries, 1995-2019
Source: OECD
Figure 6 UK transport spending is heavily biased towards London and the South East
Transport spending per capita across English regions
Source: Office of National Statistics, Country and Regional Public Sector Finances Expenditure Tables
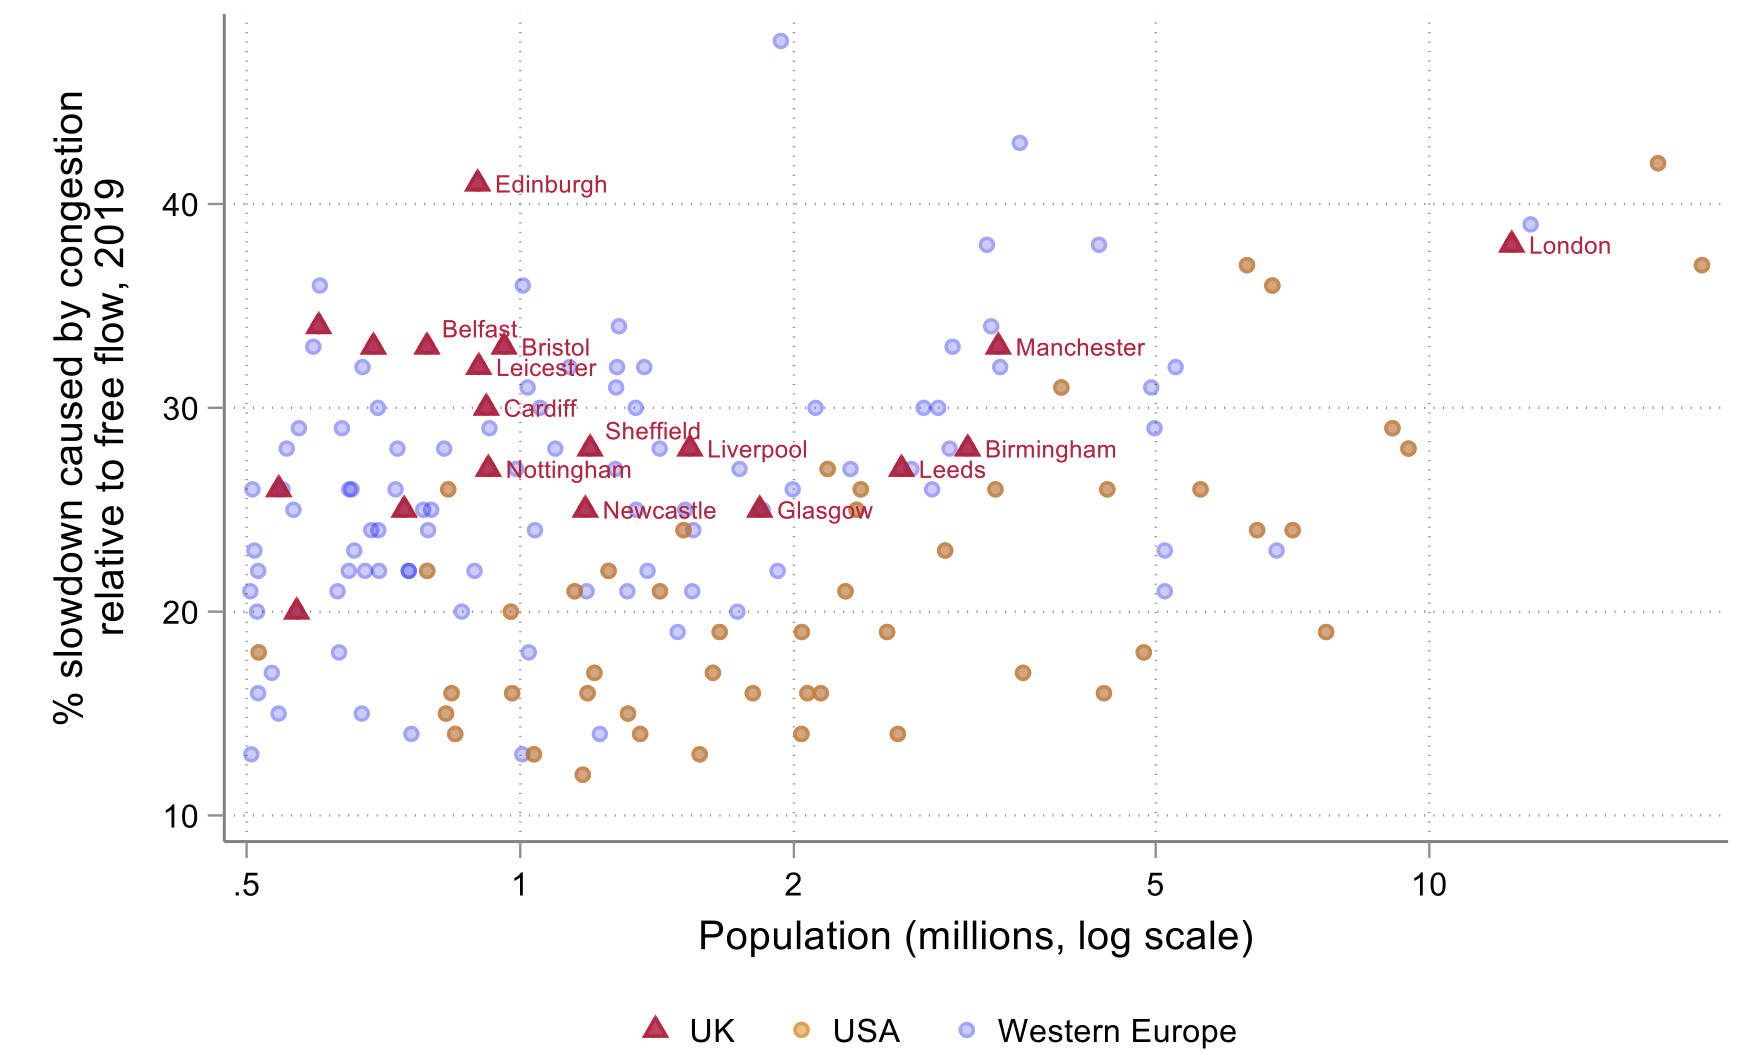
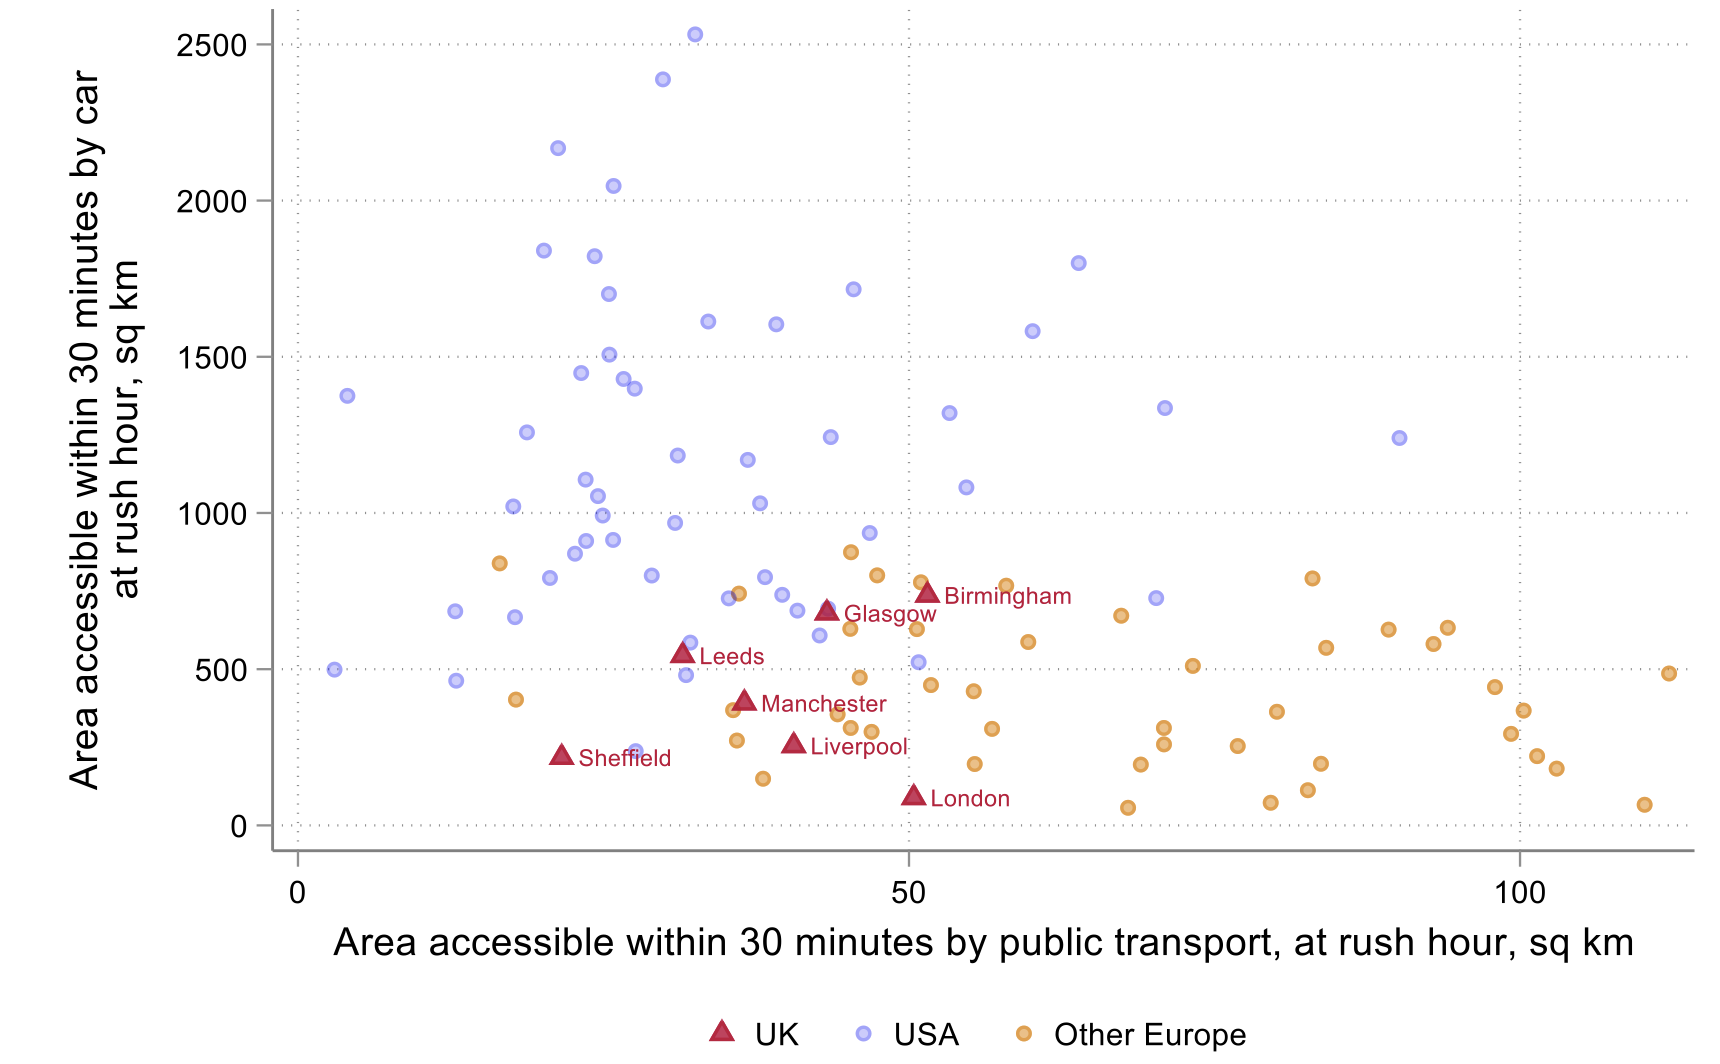
This is not necessarily a problem (if, say, the UK has a relative surplus of quality infrastructure). But our analysis finds that is not the case. The UK’s large cities outside London have smaller, more congested road networks than comparable American cities, and more limited public transport accessibility than comparable Western European cities (Figures 7 and 8). The limited scope of UK cities’ public transport network is further exacerbated by highly congested trains in specific cities, particularly Birmingham, Bristol, Cambridge, and Manchester, and by broadly unreliable rail services outside of the South East. Limited road infrastructure and poor public transport mean that the ‘effective’ labour markets for the UK’s city centres are smaller than in peer countries, perhaps contributing to the failure of agglomeration economies in cities outside London.
Figure 7 UK cities’ roads are more congested than their Western European and American peers
Road congestion in UK, US and Western European cities
Source: TomTom 2021 Congestion Index, OECD.
Figure 8 UK cities are less well connected by public transport than Western European cities, and less well connected by roads than American cities
Area accessible by road and public transport, UK, US and Western European cities
Source: Conwell et al. (2022). Estimates calculated from Google Maps, at Wednesday 8:30am.
Innovation: Public support currently amplifies, rather than corrects for, regional inequalities
Highly skilled people, connected by high quality infrastructure, may not be enough on their own to provide the necessary conditions for rapid productivity growth (e.g. Rodrik and Stantcheva 2021). The third ingredient we consider is ‘knowledge’. As a public good, it will generally be underprovided without public support (Jones and Williams 2000).
We examine the relationship between discretionary public support for R&D and private investment in R&D.
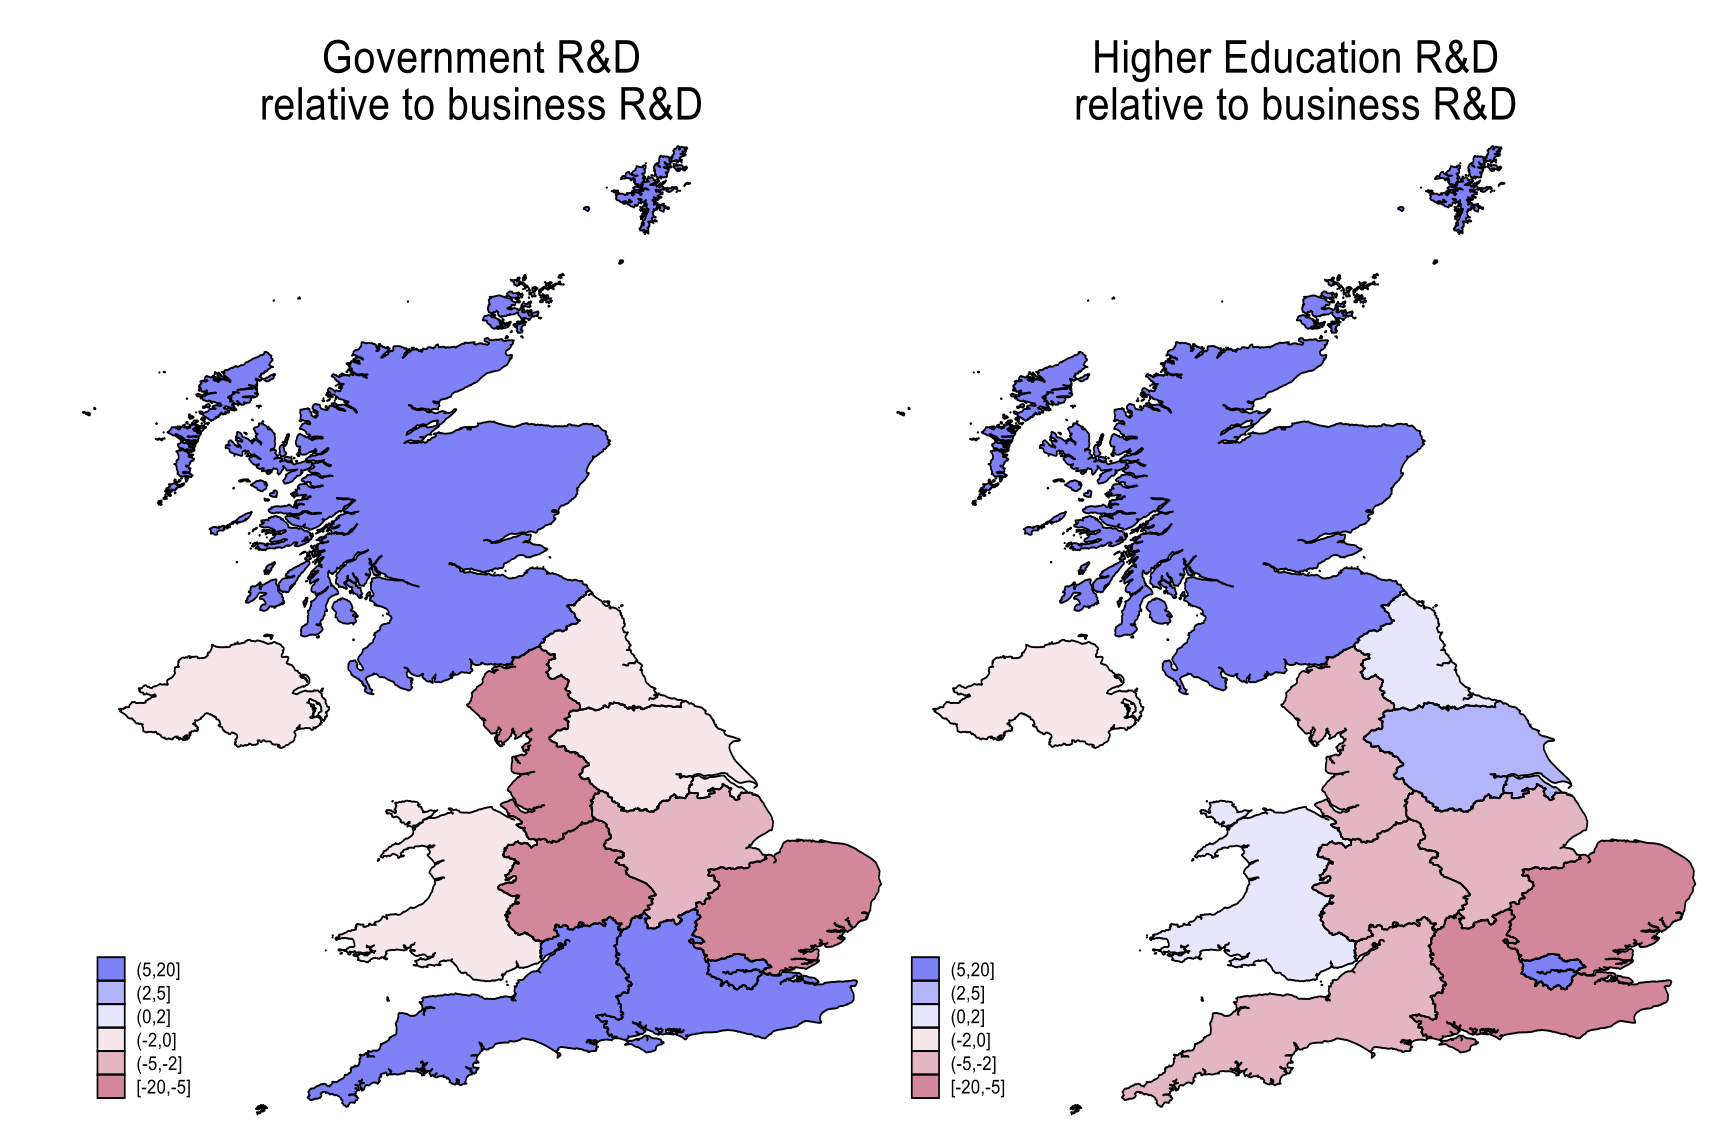
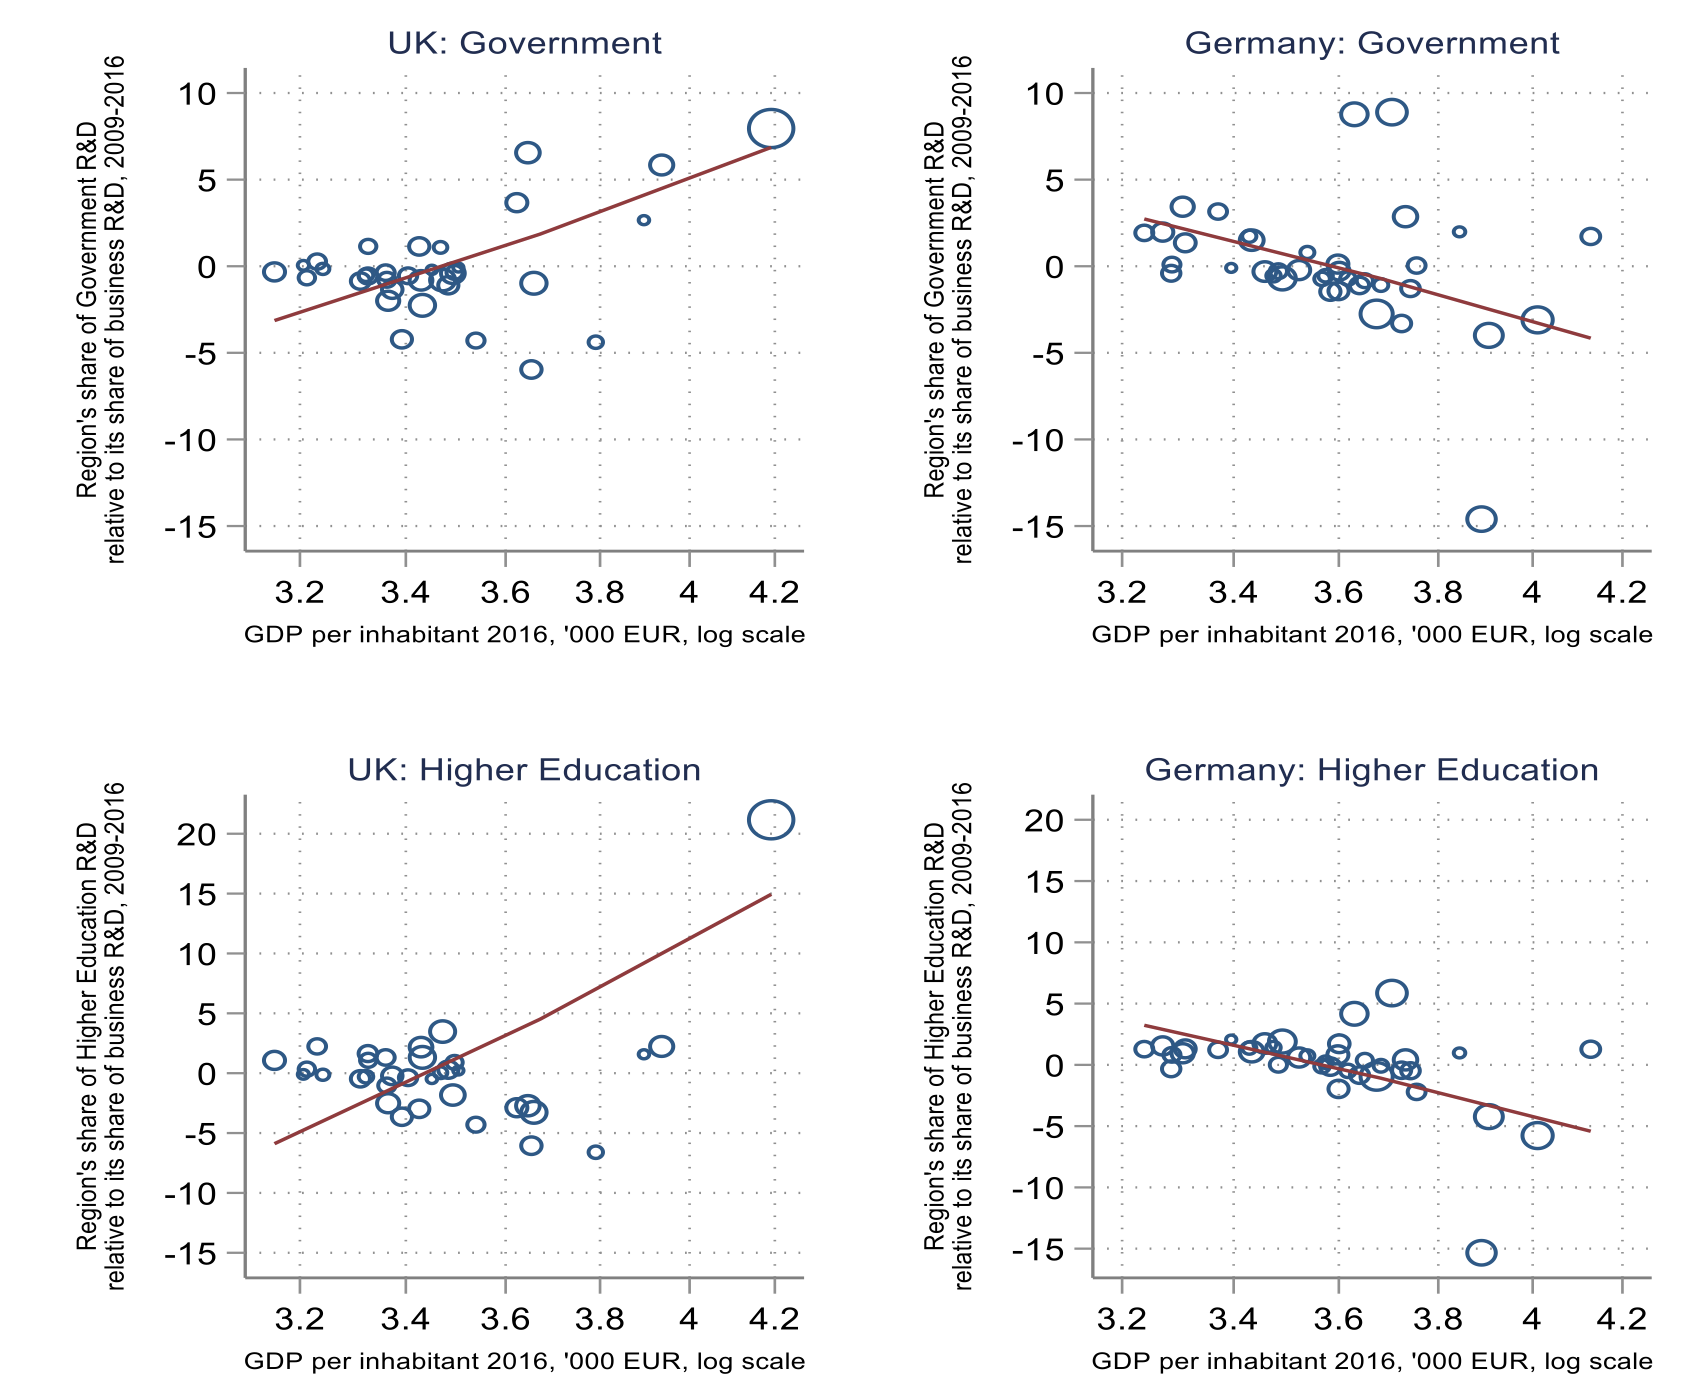
We find that public investment is more skewed than private investment towards the South of England (and Scotland) (Figure 9). The Southern bias of UK government R&D spending contrasts markedly with Germany. In Germany, public support is channelled relatively more to those (lower productivity) areas which also face lower private R&D investment; in the UK, we do the opposite (Figure 10).
Figure 9 Government R&D is more skewed to the South than business R&D
Government/higher education R&D spending share relative to business R&D spending share, by region (2001-2018 average)
Source: OECD Regional Statistics.
Figure 10 UK government support for R&D amplifies regional inequalities in business R&D spending; German government support for R&D does the opposite
Government and higher education R&D spend relative to business R&D spend: UK and Germany, 2009-2016
Source: Quality of Government EU Regional dataset.
Note: Each bubble is a small (OECD TL3) region, with bubble size weighted for each region’s population. Inner and Outer London are combined.
Finance: Too little equity investment outside of London
Finally, we consider finance. It could be that the UK’s non-London regions in fact have the skills, transport systems and innovative firms necessary for growth – but that growth is simply held back by lack of access to capital.
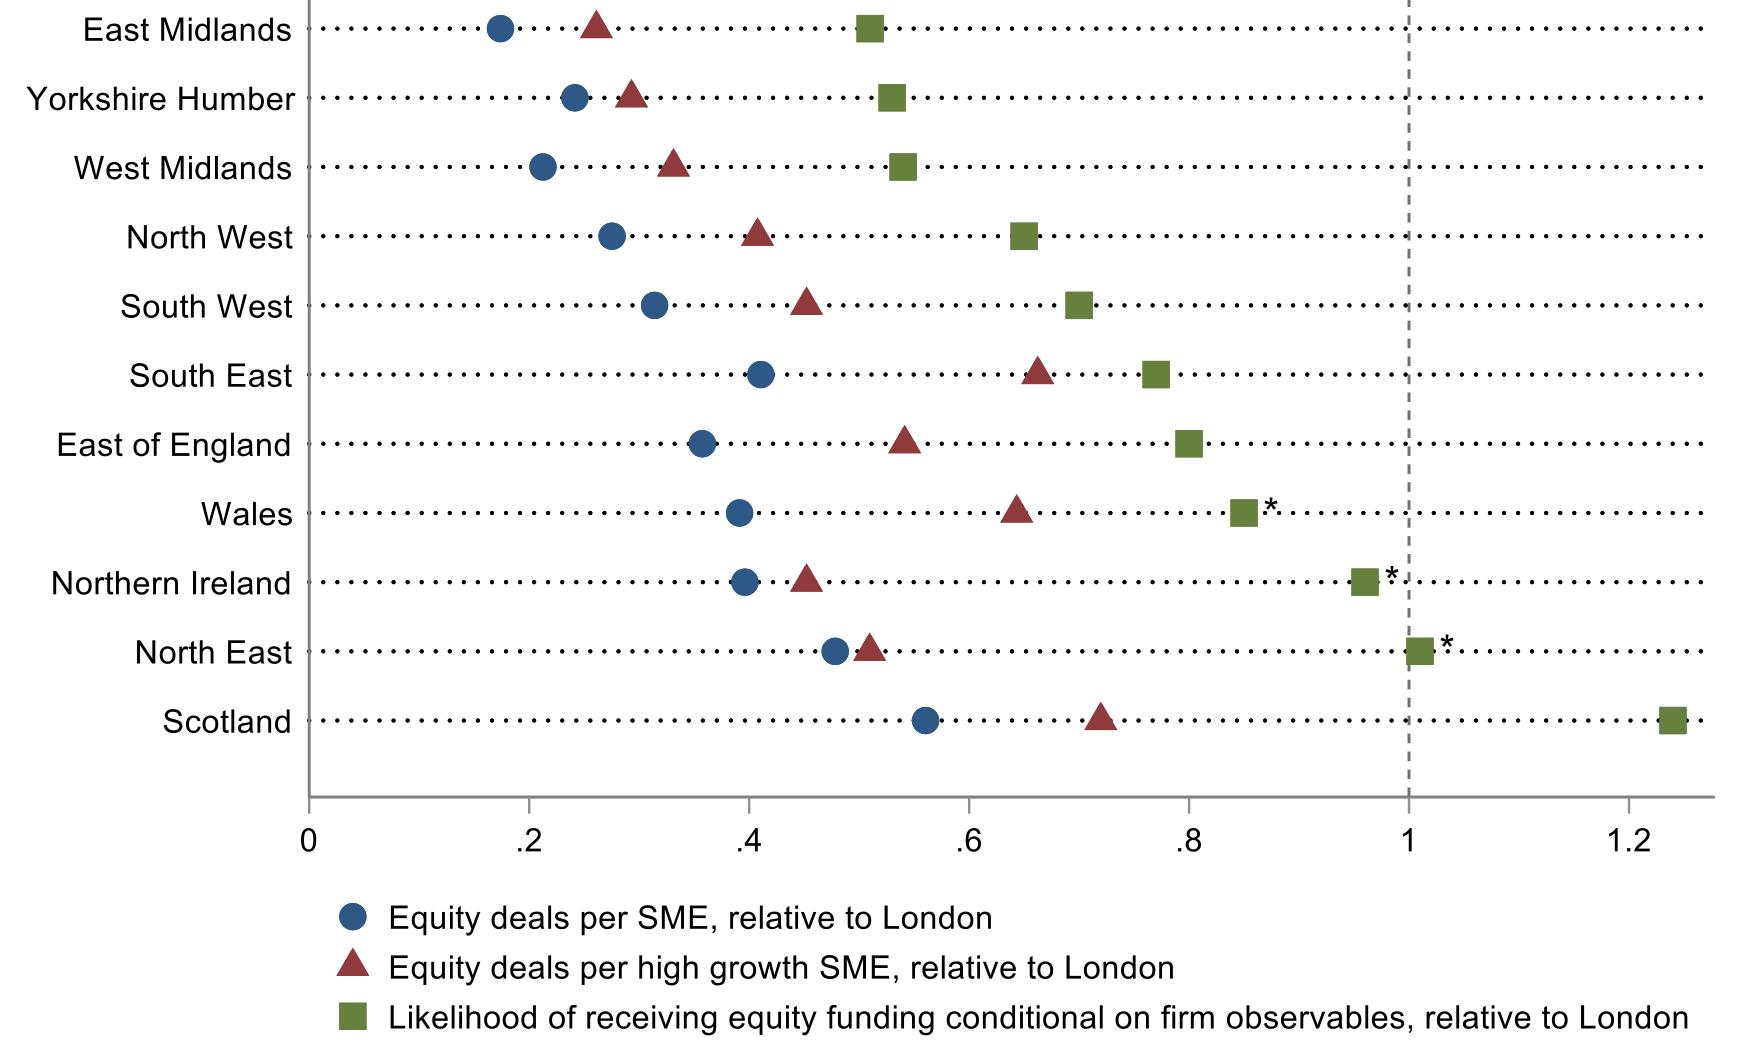
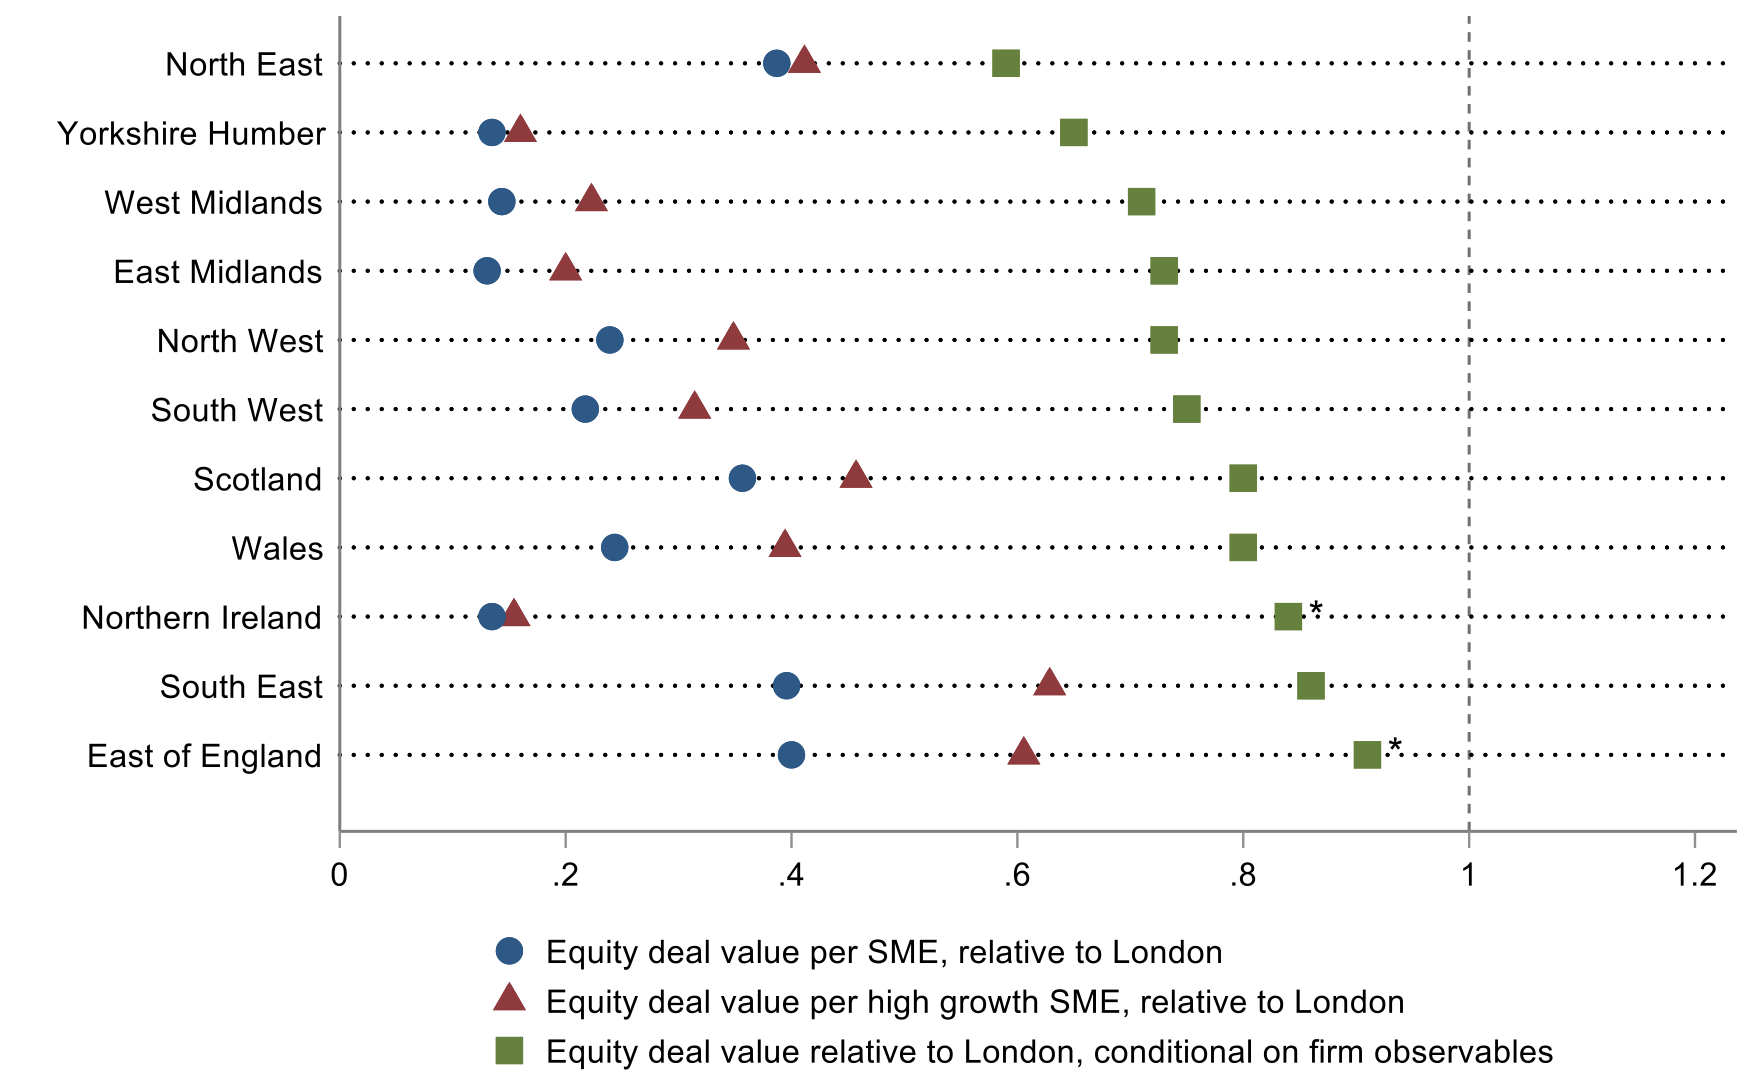
Outside of London, we find little evidence to suggest that bank lending is a problem (e.g. Armstrong et al. 2013). There is no evidence of differential access to credit, interest rates, or collateral requirements, and small and medium-sized enterprises (SMEs) in London actually report on average feeling more constrained than SMEs outside London. But for the less than 4% of SMEs who rely on equity finance (BVA BDRC 2020) – typically innovative SMEs with high growth potential – that is not so clearly the case. A London-based SME is much more likely to receive equity financing than an SME in the Midlands, Yorkshire, or the North West that is similar in terms of industry, revenues, founder characteristics, and other metrics (Figure 11, see also Wilson et al. 2019). We are unable to tell, however, if this gap is due to London-based equity investors overlooking opportunities outside the city, or if it is due to SMEs outside London having poorer growth prospects. More research is needed to answer this question.
Figure 11 SMEs in the Midlands, Yorkshire, and the North West are less likely to receive equity investment than comparable firms in London
A) Likelihood of receiving equity investment by region, 2011-17
B) Equity deal size by region, 2011-17
Source: Authors’ analysis of estimates from Wilson et al. (2019).
Note: Equity deals / deal value per SME or per high growth SME are reported directly in Wilson et al. (their Table 6). Coefficient estimates in Panel A (green squares) are odds ratios calculated by Wilson et al. from regressions of whether a firm received equity funding on firm characteristics and region dummies (their Table 18); coefficient estimates in Panel B (green squares) are regression coefficients on regressions of log deal size on firm characteristics and region dummies (their Table 21). We put asterisks by the green squares where the coefficient estimate was not significantly different from 1 (i.e. the difference in equity funding likelihood, or deal size, between the region in question and London was not statistically significant).
High housing costs in London prevent regional convergence through migration
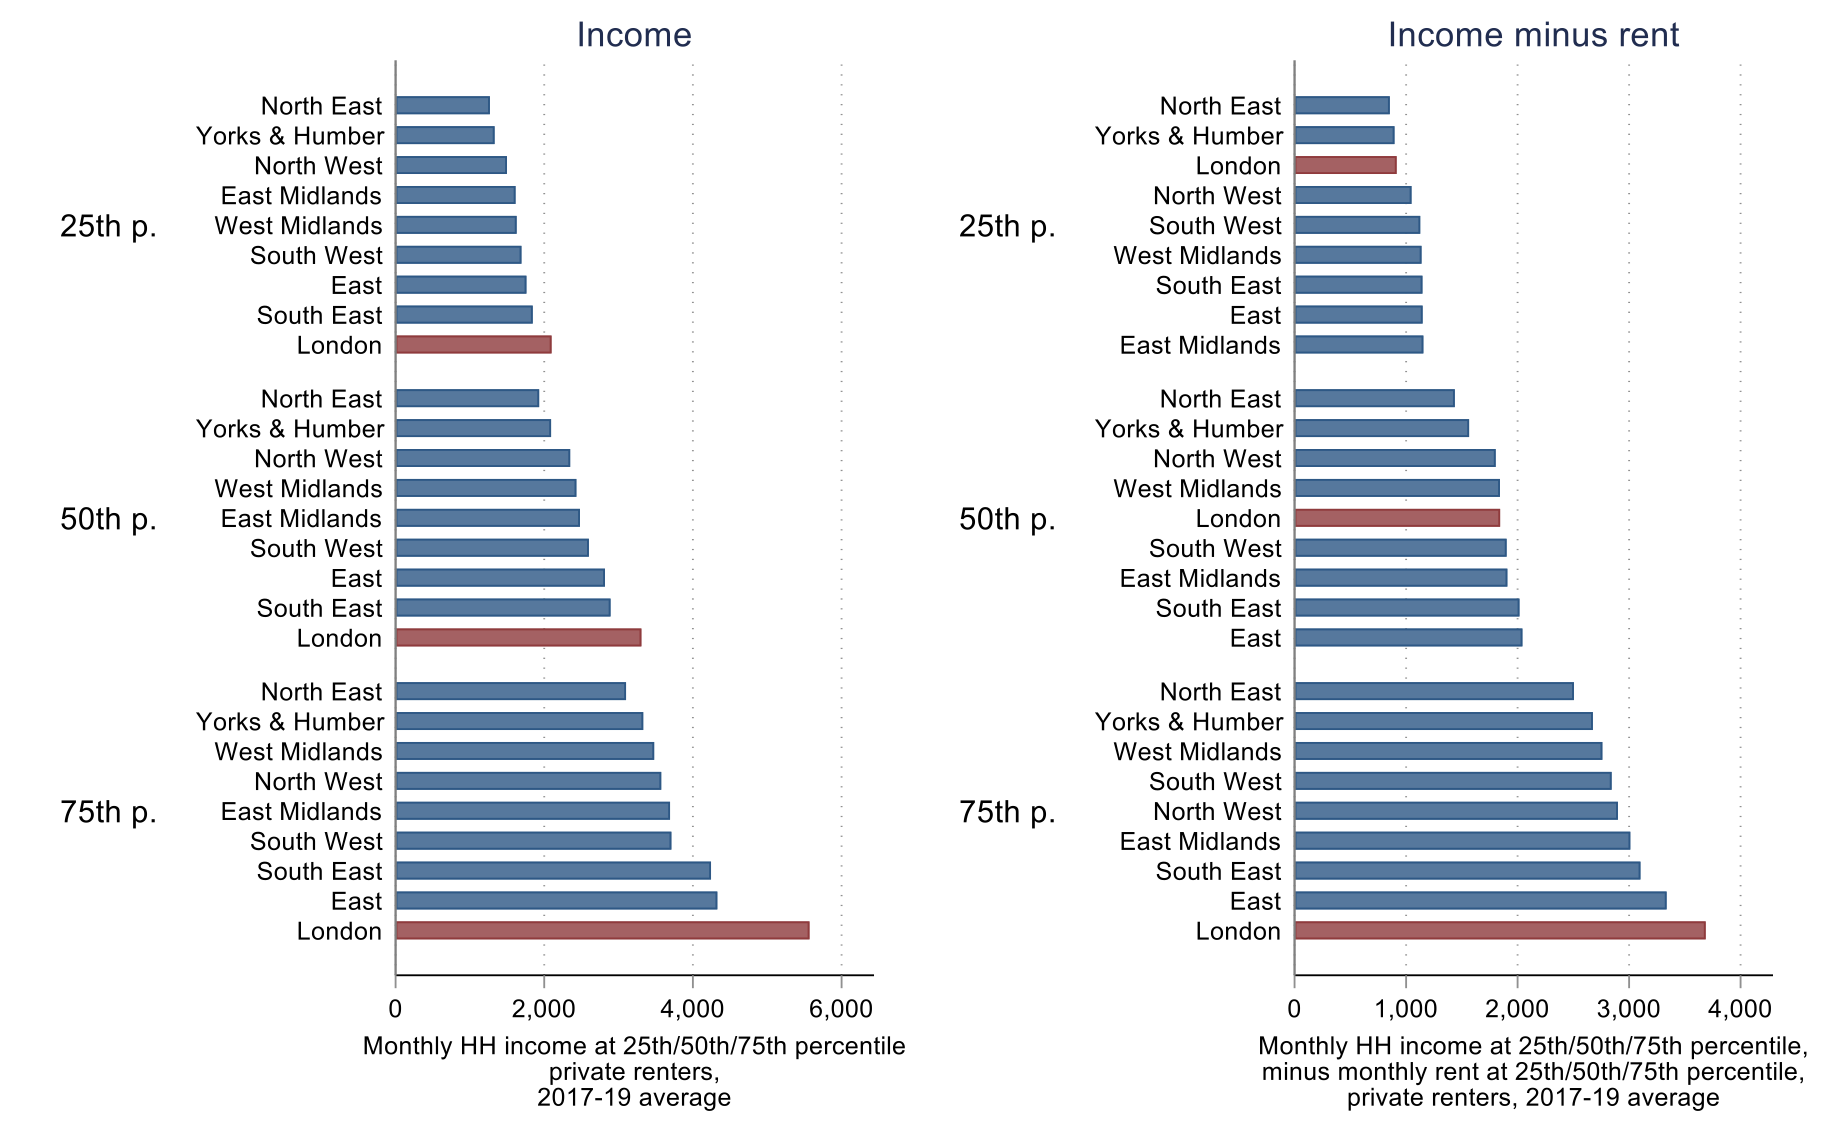
With UK residents free to move across regions, why doesn’t internal mobility lead to income convergence across regions? Unlike in the US, there has been no decline in the total volume of interregional migration in the UK in recent decades (Champion and Shuttleworth 2017). Instead, we find that internal migration flows out of rather than towards London (even as international migrants arrive in London), as high housing costs erode the real income of potential migrants to London for all but those in the top portion of the income distribution (Figure 12).
Figure 12 For many renters, incomes net of housing costs are no higher in London than in the rest of the country
Income net of rent costs for private renters, 2017-19
Source: ONS Private Rental Affordability data
Conclusion: There is a new growth model for the UK’s regions; but political economy may have to shift to realise that potential
As policymakers debate how to tackle regional inequality and, in popular terms, ‘level up’ the economy, our analysis challenges a number of common arguments about the UK’s regional economic inequality problem. We find little evidence consistent with the hypotheses that (i) low shares of university graduates remain the primary constraint on growth for the UK’s regions; (ii) there is a generalised issue with access to finance for firms outside the South East; or (iii) low or falling regional migration rates are to blame for the persistence of the UK’s regional economic inequalities.
Instead, our analyses suggest a key role for (i) boosting STEM degree-level skills; (ii) improving transport provision (both capital spending and public transport) in major non-London conurbations; (iii) more public investment in R&D and innovation in clusters beyond the South East; and (iv) alleviating housing supply and affordability constraints in greater London. We also find some suggestive evidence to support a role for policy in boosting access to early-stage equity financing for high-growth-potential SMEs outside London and the South East.
Building on the success of the UK-wide expansion of access to university education over the past few decades, these interventions should help raise both regional and national productivity, and close gaps between regions. This may not be enough to outweigh the force of global economic trends like the rise of finance, or the path dependence generated by economic agglomerations – as the persistence of East/West divisions in Germany despite substantial policy effort makes clear. But our analysis suggests that much more could be done.
Finally, we note that the persistence – and indeed, in recent decades, expansion – of gaps between UK regions tell us that this problem is unlikely to fix itself. UK regional policy has faced endemic policy churn and institutional instability (Zymek and Jones 2020), which likely contributed to the UK’s regional productivity problem. This will be the subject of a companion contemporary history paper summarising findings from over 80 practitioner interviews with top-level decision makers in UK regional economic development over the period 1979-2015 (Turner et al. forthcoming).
References
Armstrong, A, E P Davis, I Liadze, and C Rienzo (2013), "Evaluating Changes in Bank Lending to UK SMEs over 2001-12–Ongoing Tight Credit", Department for Innovation, Business and Skills.
Carrascal-Incera, A, P McCann, R Ortega-Argilés, and A Rodríguez-Pose (2020), “UK Interregional Inequality in a Historical and International Comparative Context”, National Institute Economic Review 253: R4–17.
Conwell, L, F Eckert, and A Mushfiq Mobarak (2022) “More Roads or Public Transit? Insights from Measuring City-Center Accessibility”, Working Paper.
Ehrlich, M v, and H G Overman (2020), “Place-Based Policies and Spatial Disparities across European Cities”, Journal of Economic Perspectives 34(3): 128–49.
Farquharson, C, S McNally, and I Tahir (2022), “Education Inequalities”, IFS.
Forth, T (2017), “The Most Important Graph in British Economics”, 4 April.
Forth, T (n.d.) “Researching R&D”,
Graham, D J, and S Gibbons (2019), “Quantifying Wider Economic Impacts of Agglomeration for Transport Appraisal: Existing Evidence and Future Directions”, Economics of Transportation 19: 100121.
Harris, R, and J Moffat (2022), “The Geographical Dimension of Productivity in Great Britain, 2011–18: The Sources of the London Productivity Advantage”, Regional Studies 56(10): 1713–28.
Hausmann, R, D Rodrik, and A Velasco (2008), “Growth Diagnostics”, in The Washington Consensus Reconsidered: Towards a New Global Governance, 324–55.
Ilzetzki, E (2020), “Explaining the UK’s Productivity Slowdown: Views of Leading Economists”, VoxEU.org, 11 March.
Ilzetzki, E (2022), “Levelling up Productivity Gaps in the UK”, VoxEU.org, 20 July.
Jones, C I and J C Williams (2000), “Too Much of a Good Thing? The Economics of Investment in R&D”, Journal of Economic Growth 5(1): 65–85.
Marmot, M (2020), “Health Equity in England: The Marmot Review 10 Years On”, BMJ, February, m693.
McCann, P (2020), “Perceptions of Regional Inequality and the Geography of Discontent: Insights from the UK”, Regional Studies 54(2): 256–67.
OECD (2015), “The Metropolitan Century: Understanding Urbanisation and Its Consequences", READ Online.
Özgüzel, C (2020a), “Agglomeration Economies in Great Britain”,
Özgüzel, C (2020b), “Agglomeration Economies in Great Britain”, OECD Regional Development Working Papers 2020/04.
Poelman, H, A Rodríguez-Pose, and L Dijkstra (2019), “The Geography of EU Discontent”, VoxEU.org, 7 December.
Rice, P, A J Venables, and E Patacchini (2006), “Spatial Determinants of Productivity: Analysis for the Regions of Great Britain”, Regional Science and Urban Economics 36(6): 727–52.
Rodríguez-Pose, A (2018), “The Revenge of the Places That Don’t Matter”, VoxEU.org, 6 February.
Rodríguez-Pose, A, M Storper, and S Iammarino (2018), “Regional Inequality in Europe: Evidence, Theory and Policy Implications”, VoxEU.org, 13 July.
Rodrik, D, and S Stantcheva (2021), “Fixing Capitalism’s Good Jobs Problem”, Oxford Review of Economic Policy 37(4): 824–37.
Sanchis-Guarner, R, T Lyytikäinen, H Overman, and S Gibbons (2017), “New Road Infrastructure: The Effects on Firms”, VoxEU.org, 27 July.
Stansbury, A, D Turner, and E Balls (2023), “Tackling the UK’s Regional Economic Inequality: Binding Constraints and Avenues for Policy Intervention”, HKS MRCBG Working Paper (March).
Turner, D, N Weinberg, E Elsden, and E Balls (forthcoming), “UK Growth Policy 1979-2015”,
Wilson, N, M Kacer, and M Wright (2019), “Equity Finance and the UK Regions: Understanding Regional Variations in the Supply and Demand of Equity and Growth Finance for Business”, BEIS Research Paper.
Wolf, N, and J Ramón Rosés (2018), “The Return of Regional Inequality: Europe from 1900 to Today”, VoxEU.org, 14 March.
Zymek, R, and B Jones (2020), “UK Regional Productivity Differences: An Evidence Review”, February.


