Following the Russian invasion of Ukraine in February 2022, the EU and several countries (US, Japan, UK, Canada, and Australia, among others) imposed extensive sanctions on Russia (Garicano et al. 2022). Overall, sanctions have curbed Russian export earnings (Babina et al. 2023) and eroded Russia’s long-term growth potential (Demertzis et al. 2022, Simola 2022, Borin et al. 2023) through different channels including restricted access to financial resources, capital goods, and technologies.
Given Russian dependency on foreign supplies of critical components and final goods, its capability to source these products after sanctions is crucial for Russia’s economic perspectives. Previous analyses have shown that Russian aggregate imports fell after the invasion (Borin et al. 2022), but a more in-depth scrutiny of the evolution of trade flows at the geographical and product level can give better insights on sanctions’ effectiveness.
In this column, we provide novel evidence on the impact of trade bans on Russian imports by exploiting a unique dataset on the export restrictions imposed by the EU – by far the largest Russian trade partner in pre-war times – throughout 2022. By combining trade restrictions with both customs data on Russian imports and other countries’ exports to Russia (‘mirror statistics’), we can achieve more robust and detailed results thanks to the granular information they provide us (e.g. production and departure countries of products).
What has been the impact of EU trade restrictions on Russian imports?
The EU has imposed export bans on the sale of goods to Russia, affecting approximately one-third of their overall value. Restrictions on transport equipment account for more than 45% of the total value of banned products, followed by chemicals (19%), electronics (12%), and machinery (11%). The share of products covered by sanctions within an industry varies significantly, with intermediates more affected than final goods (40% versus 23%, respectively).
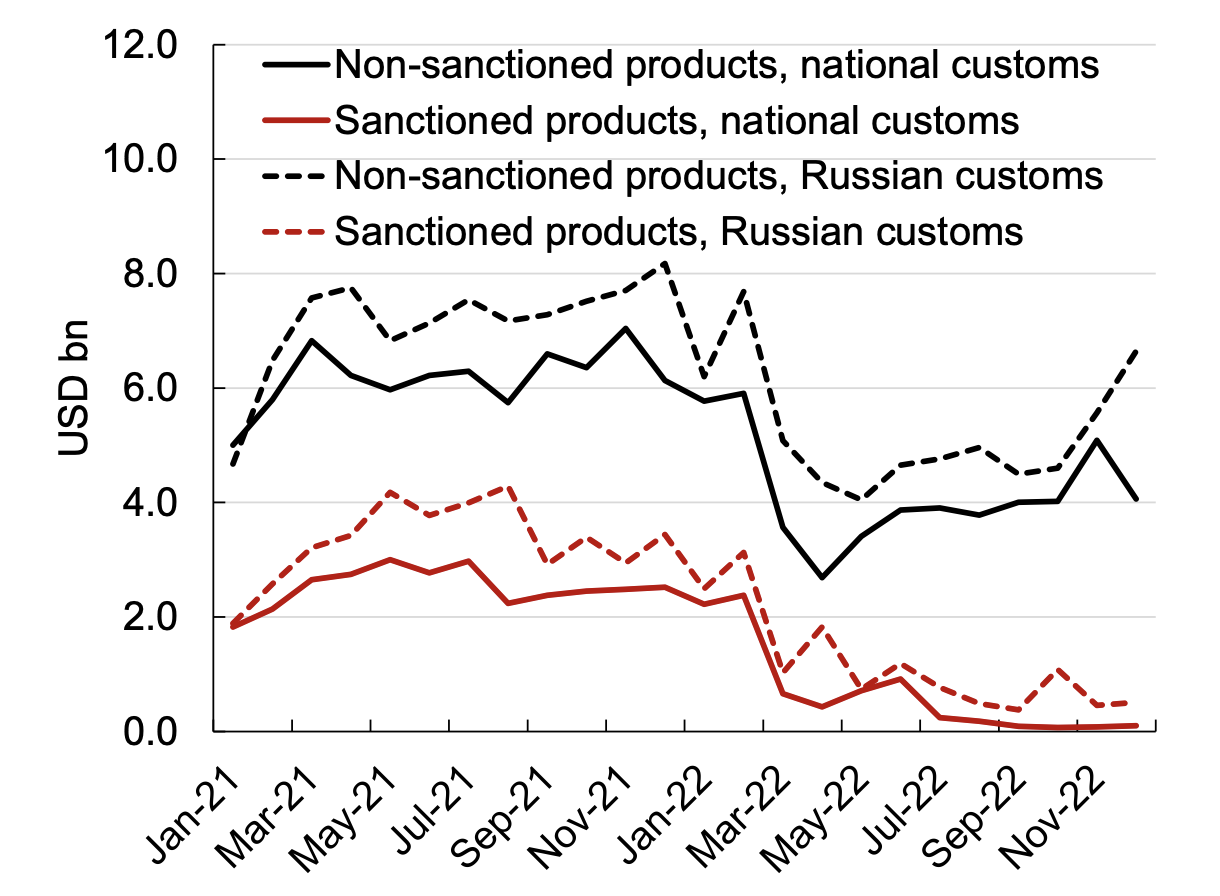
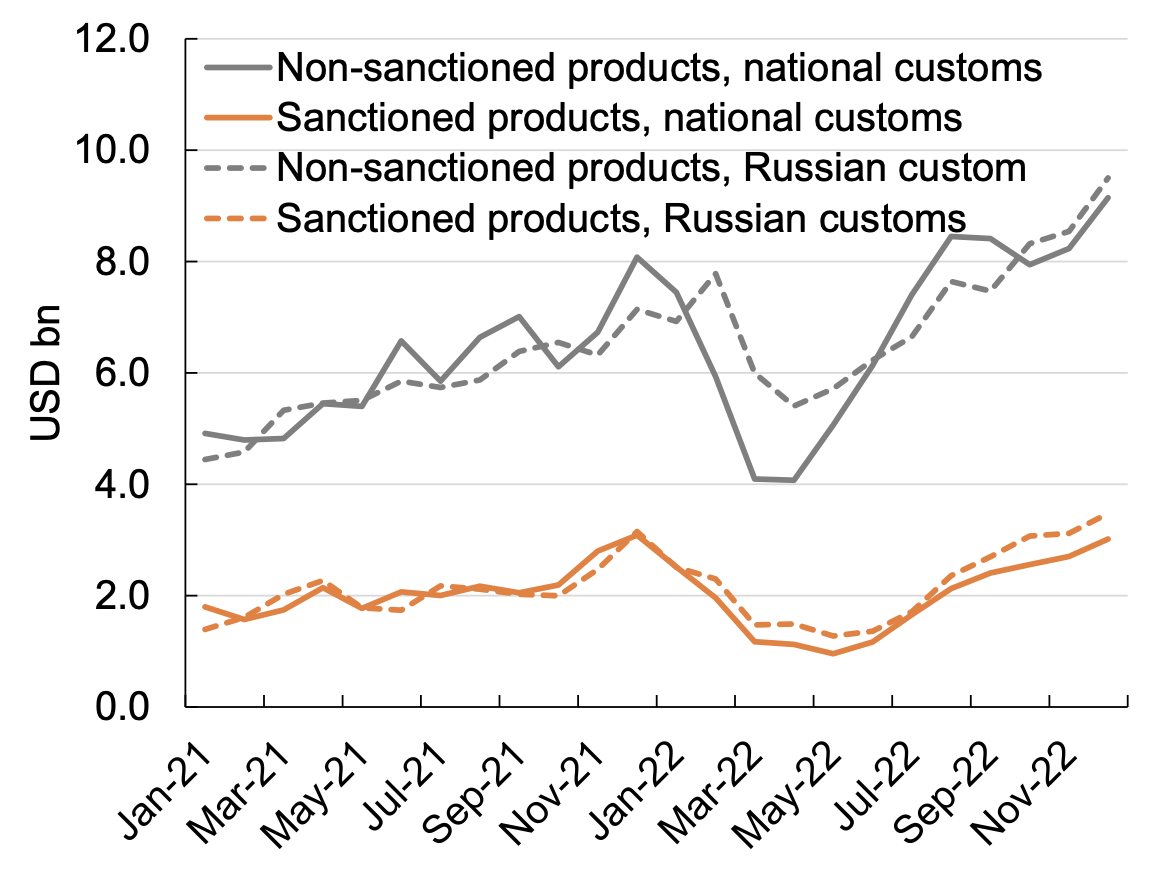
EU exports to Russia of restricted products had been steadily declining towards zero. At the same time, exports of non-sanctioned items edged up in the last quarter of 2022 (Figure 1). Non-sanctioning countries’ exports to Russia have been on the rise since April-May 2022, according to both Russian customs and mirror trade statistics, for both sanctioned and non-sanctioned products (Figure 2). In the last quarter of 2022, when EU exports in sanctioned products came close to a halt, those from non-sanctioning countries slightly exceeded pre-war values.
Figure 1 EU exports to Russia, sanctioned and non-sanctioned products ($ billion)
Figure 2 Non-sanctioning countries exports to Russia, sanctioned and non-sanctioned products ($ billion)
Source: Trade Data Monitor and dataset on EU sanctions on Russia
Has Russia been able to substitute EU and other sanctioning countries imports?
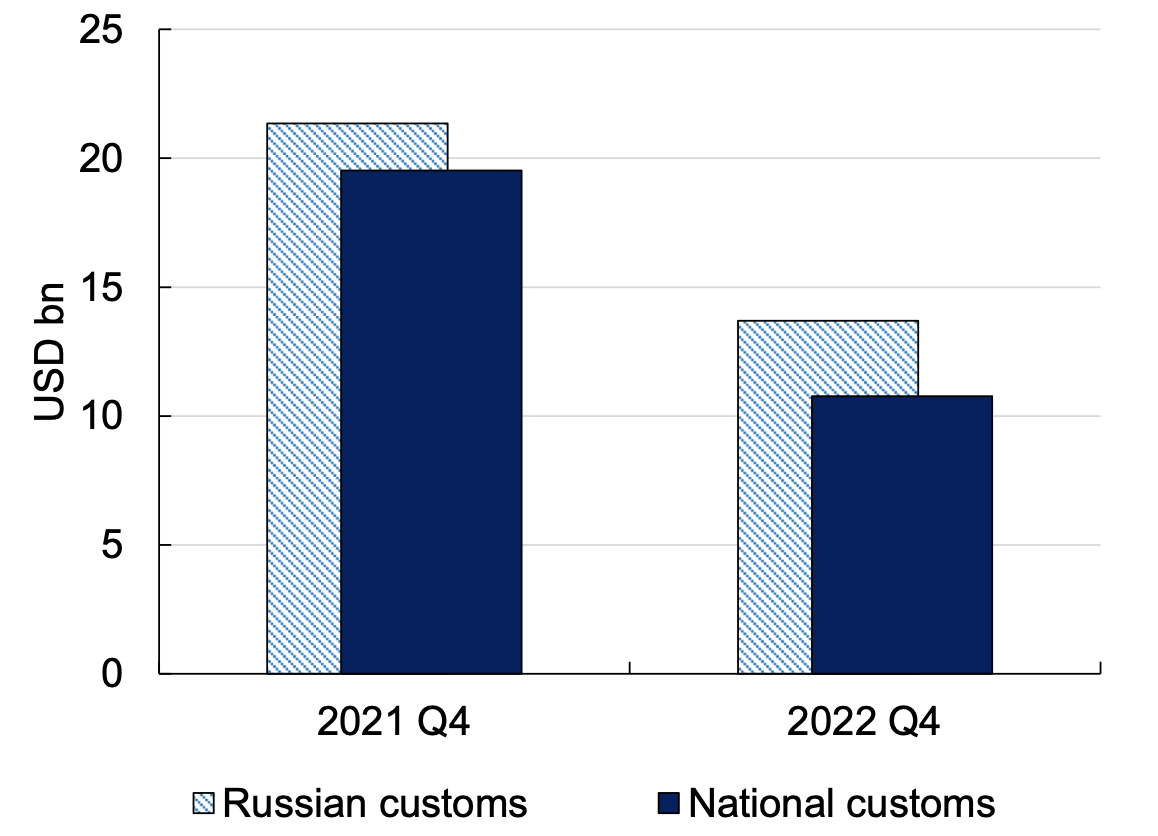
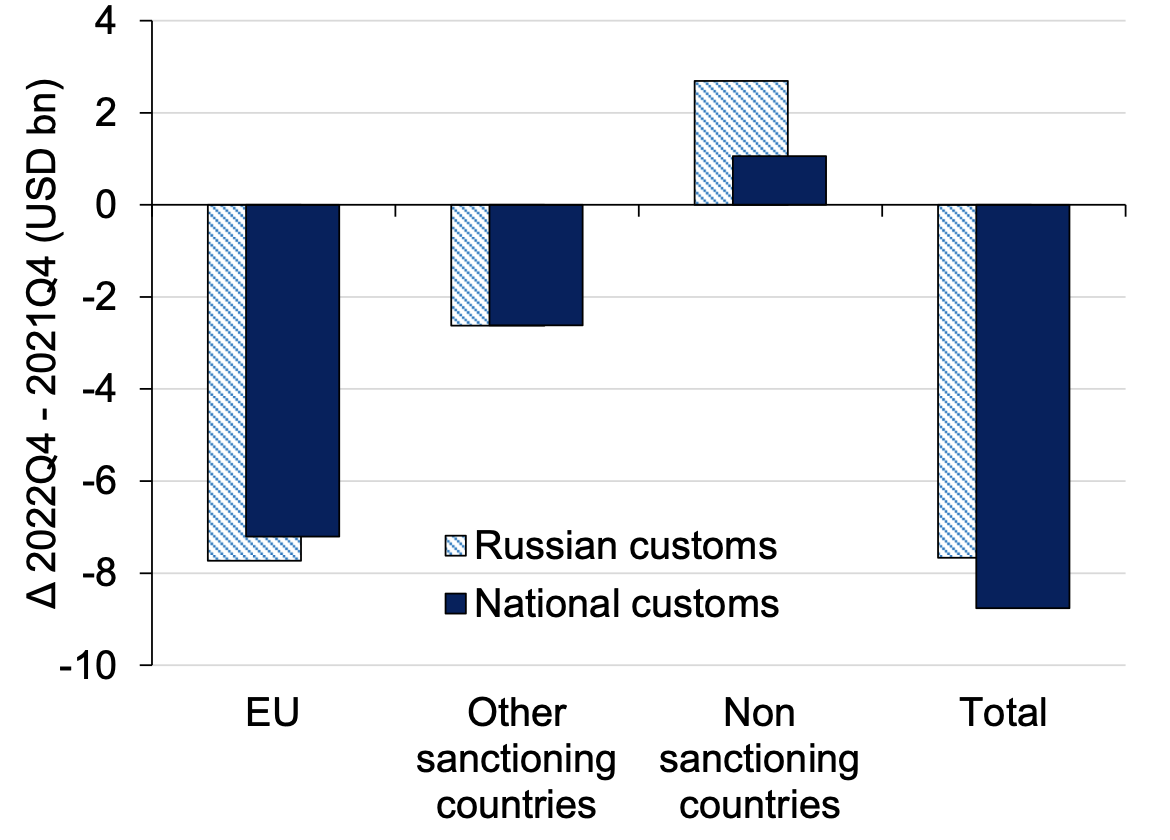
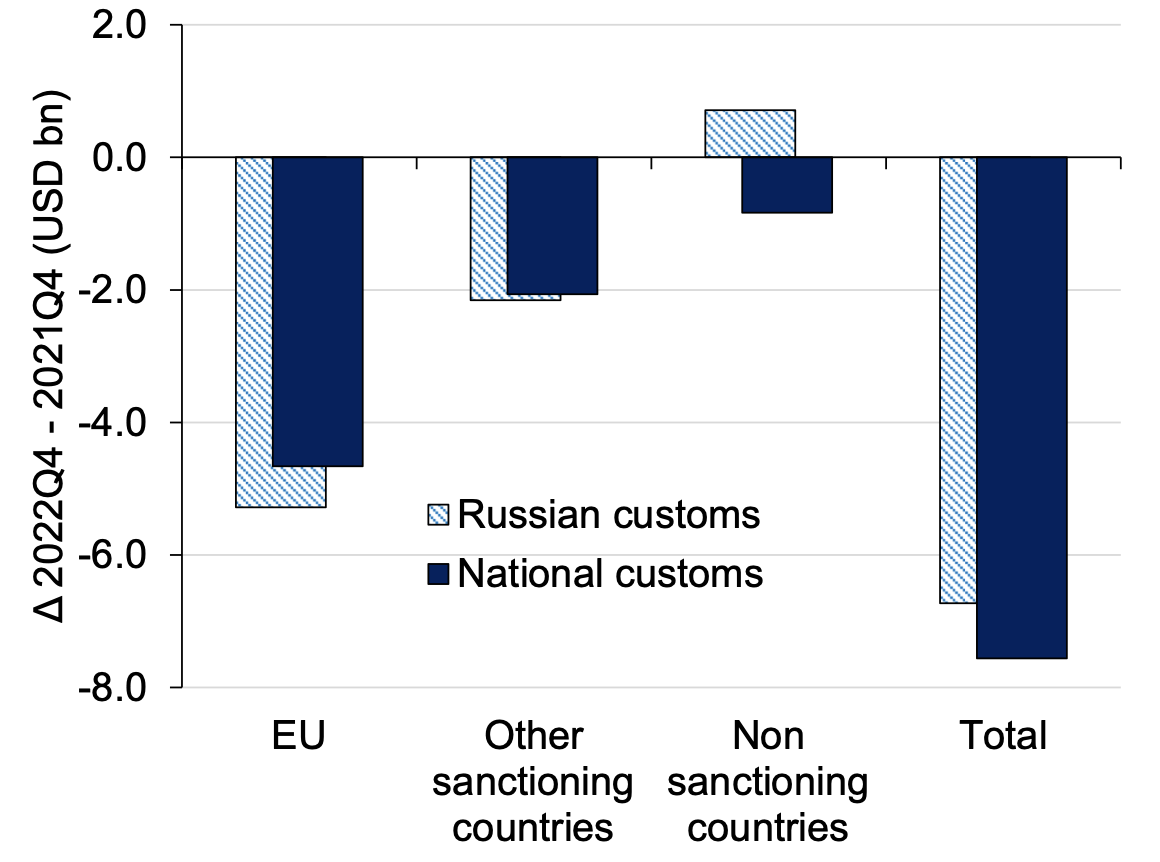
Once EU export bans were fully in force, total Russian imports substantially dropped, as EU products were not fully substituted (Figure 3). Overall, the increase in imports from non-sanctioning countries has substituted between 10% and 25% of missing shipments in EU-restricted products from sanctioning countries in 2022 Q4, depending on the data source, leading to a shortage of products worth between $7.7 billion and $8.8 billion in just one quarter (Figure 4). Flows from non-sanctioning countries increased only modestly while those from the EU and other sanctioning countries collapsed.
The degree of import substitution for restricted mid- and high-tech products is even lower than average.
The aggregate evidence conceals significant product-level heterogeneity in the degree of substitution. One might expect that Russia would focus its efforts on replacing high-tech products rather than less strategic ones, especially in view of rising military needs. However, substituting mid- and high-tech products is harder because sanctioning countries before the war supplied over half of Russia’s imports. Since trade bans have become effective, the degree of import substitution for these products has been very limited, and the incidence of sanctions on them very high. Imports from non-sanctioning countries were almost unchanged, while those from the EU and other sanctioning countries dropped by more than 80%, generating a shortage of $7 billion in just one quarter (Figure 5).
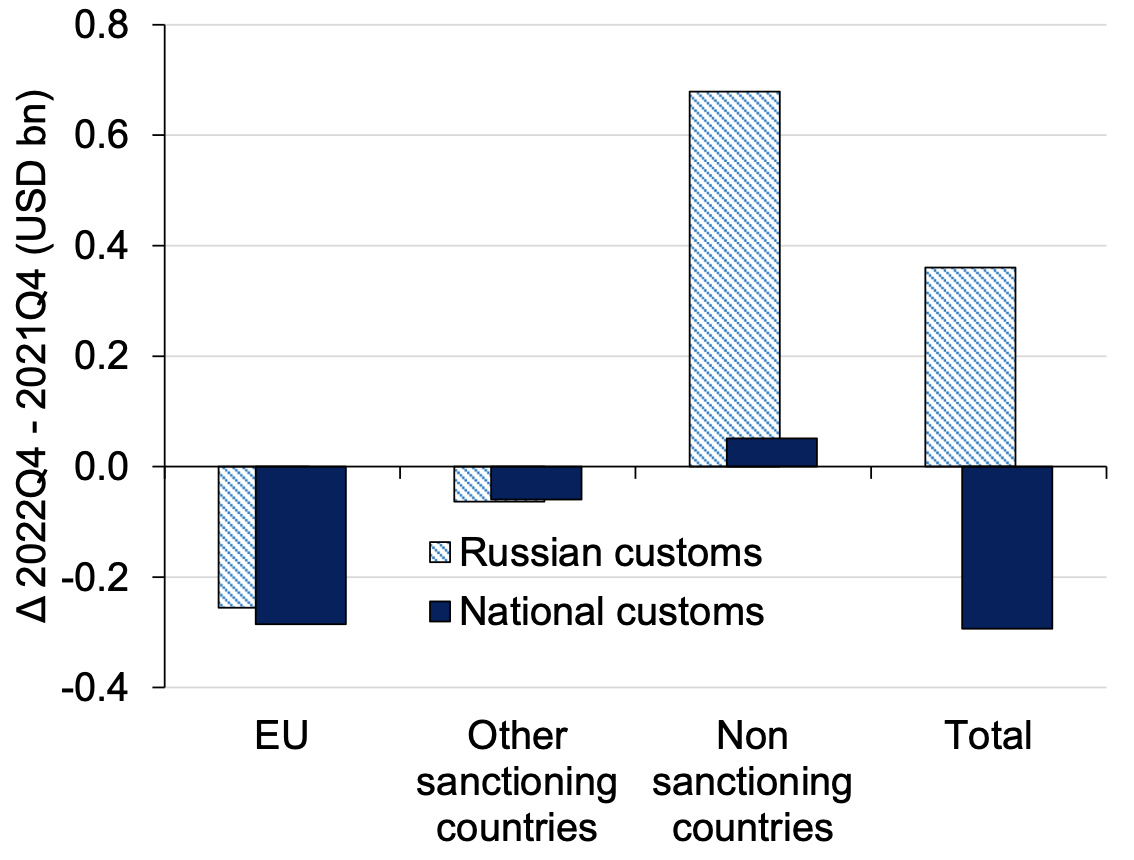
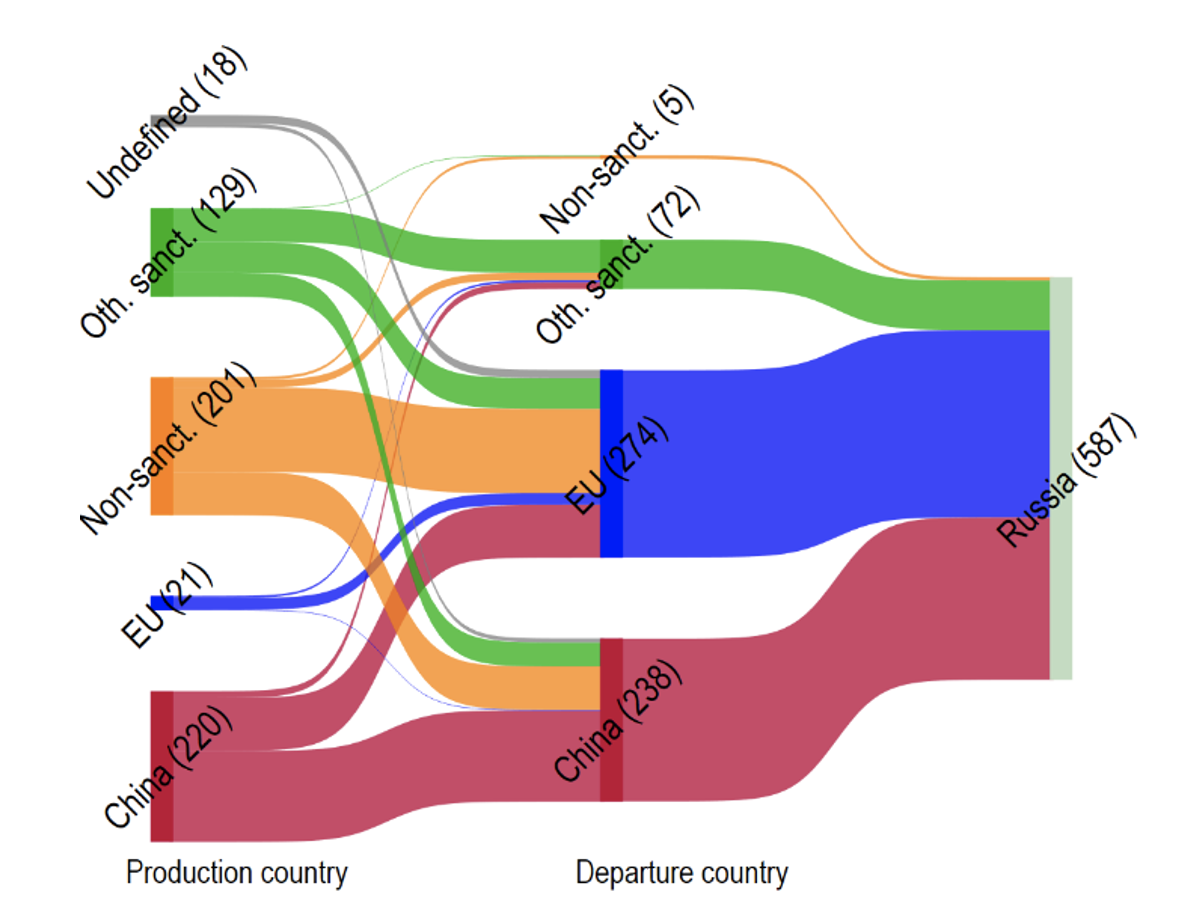
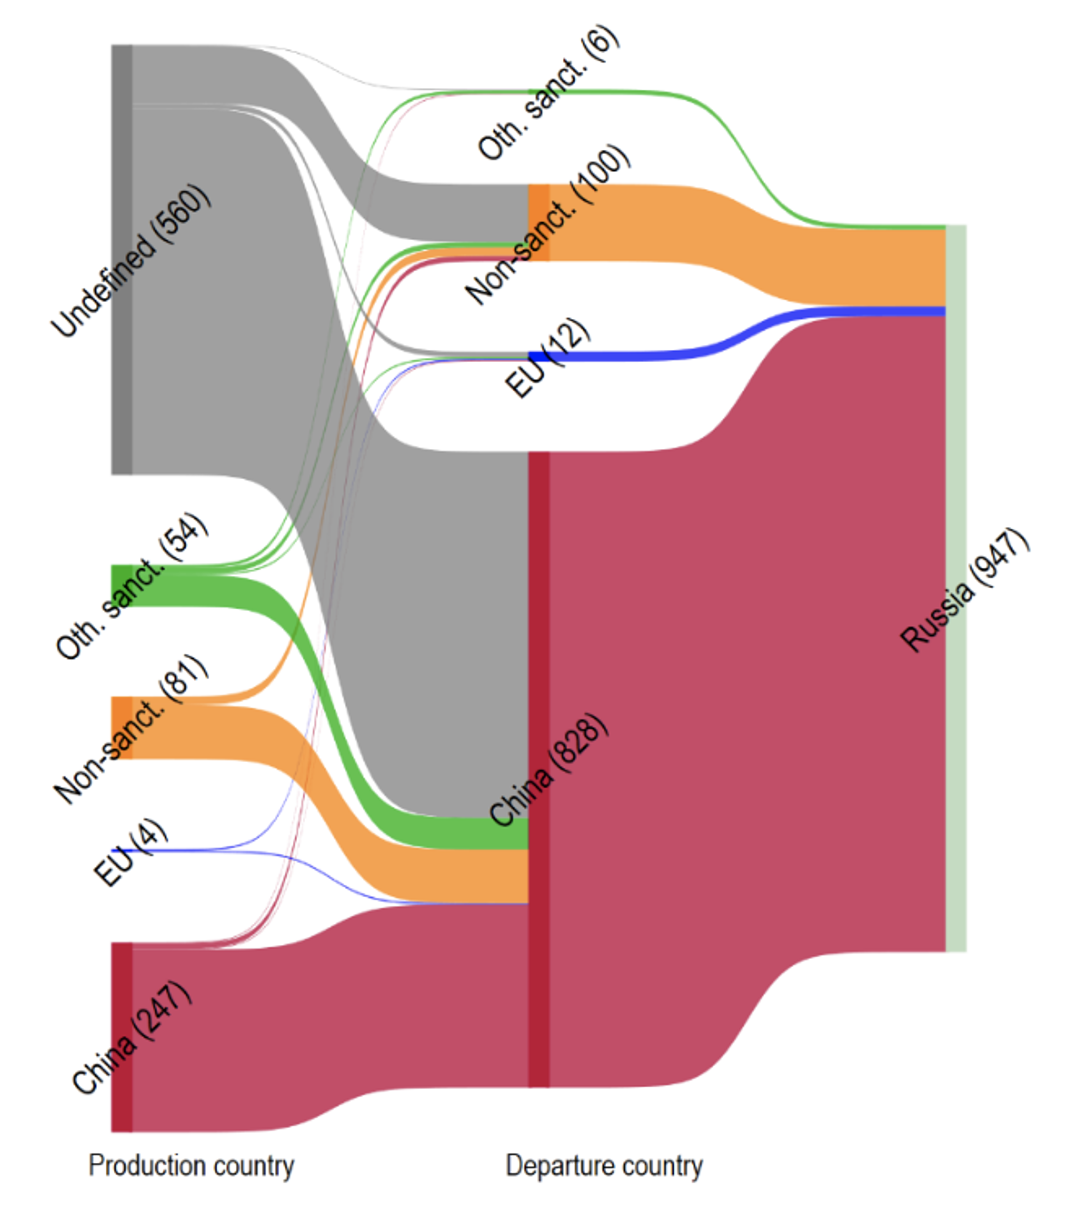
Semiconductors may be a relevant exception as the evidence varies substantially depending on the data source. Semiconductors and electronic integrated circuits account for just 1% of the total value of Russian imports but are crucial for some industries, including military applications. Exports from the EU and other sanctioning countries zeroed out since the bans became effective, but those from non-sanctioning economies increased. However, the extent of semiconductor import substitution differs across the two data sources. It is quite modest in mirror trade statistics, leaving overall almost a $300 million gap in Russian semiconductors’ imports (Figure 6). Instead, Russian customs data point to a sharp surge in exports from non-sanctioning countries almost entirely driven by a rise in exports from China, which is not found in mirror statistics. The latter data source offers more insights into the phenomenon as they report both the trading partner and the country of origin of the products. It turns out that most of the increase in Russian imports from China has an unreported origin. The share of semiconductors with unknown production origin was negligible at the end of 2022 (Figure 7), whereas it became substantial after the war, accounting for almost half of Russian imports of semiconductors (Figure 8). This suggests that these goods might have been produced in other countries, including the sanctioning ones.
Figure 3 Russian imports in EU-restricted products, 2022Q4 vs. 2021Q4 ($ billion)
Figure 4 Change in Russian imports in EU-restricted products by country group ($ billion)
Source: Trade Data Monitor and dataset on EU sanctions on Russia
Figure 5 Change in Russian imports in mid- and high-tech EU-restricted products, 2022Q4 vs. 2021Q4 ($ billion)
Figure 6 Change in Russian imports in semiconductors and electronic integrated circuits, 2022Q4 vs. 2021Q4 ($ billion)
Source: Trade Data Monitor and dataset on EU sanctions on Russia
Figure 7 Russian imports of semiconductors and electronic integrated circuits, by country of production and departure, 2021Q4 ($ million)
Figure 8 Russian imports of semiconductors and electronic integrated circuits, by country of production and departure, 2022Q4 ($ million)
Source: Russian customs data and dataset on EU sanctions on Russia
Have EU products been re-routed by other countries towards Russia?
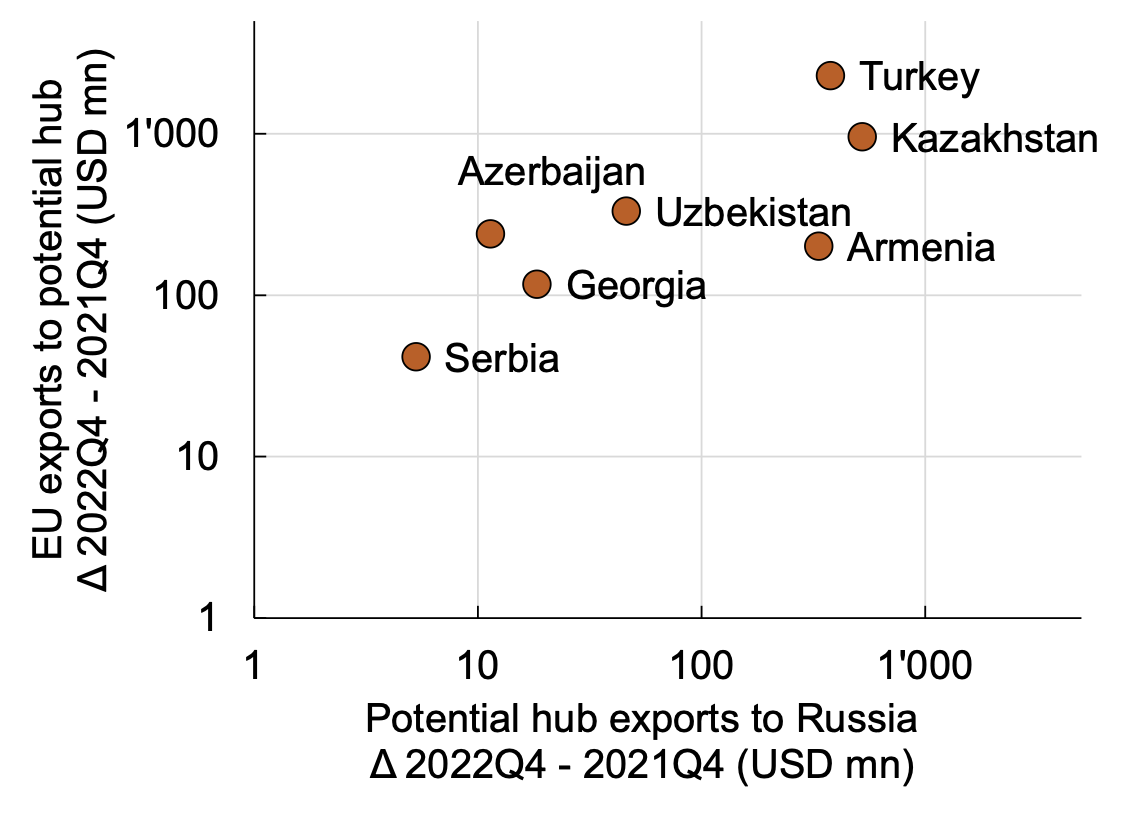
Even if the overall degree of import substitution has been limited, between 10% and 25%, some EU products targeted by export restrictions might have been redirected to Russia. A possible route followed by these exports can be traced by observing that both imports from the EU and exports to Russia rose markedly for some countries (for example, Turkey, Kazakhstan, and Armenia; Figure 9). Also, other bordering countries and Serbia emerge as potential routes to Russia.
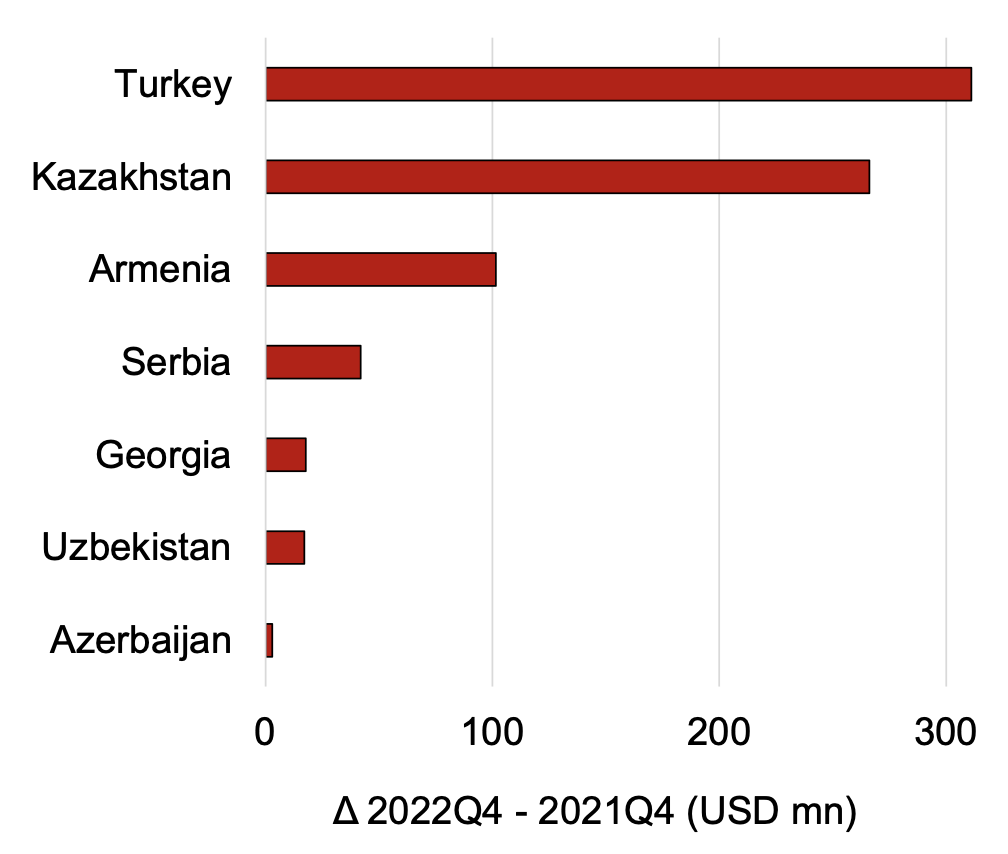
We provide some tentative quantification of the pass-through of EU products to Russia via these non-sanctioning countries. For each product targeted by EU export bans, we consider as potentially re-routed the lower value between the increase in exports from the EU to potential hubs and the increase in exports from potential hubs to Russia. Overall, the potential re-routing in EU-restricted products amounts to $760 million, 75% of it going through Turkey and Kazakhstan (Figure 10). Given that the total drop in EU-restricted exports to Russia in 2022Q4 was about $7.5 billion, 10% of these missing exports might have been re-routed through third countries to Russia.
Other sources of sanctions evasions are also possible. Re-routing through other non-sanctioning economies may occur but would be much more difficult to detect. For instance, in the case of China, the large size of the domestic demand and production would be a major confounding factor, as it might dilute the extent of re-routing. Moreover, products exported by the EU and destined for third countries according to EU customs may be instead shipped to Russia without even being recorded in third countries’ imports. Indeed, the discrepancies between exports reported by the EU and imports reported by third countries, labelled as 'ghost trade’, have increased for some countries (e.g. Kazakhstan and Armenia).
Our preliminary analysis confirms this evidence at the aggregate level. However, based on more granular data, the increase in discrepancies is similar for both sanctioned and non-sanctioned products. Thus, the source of these discrepancies requires further investigation because factors other than sanctions evasion may be at play (e.g. changed transport routes or disrupted logistics).
Evidence of re-routing seems restricted to a subset of sanctioned items. Russian imports of mobile phones skyrocketed from Armenia, Kazakhstan, Serbia, and Turkey, and, at the same time, EU exports to these countries recorded a substantial increase. A similar pattern emerges in Russian imports of computers from Kazakhstan and Turkey and cars from Armenia and Turkey.
Figure 9 Change in imports from the EU vs. change in exports to Russia for potential hubs and sanctioned products, 2022Q4 vs. 2021Q4 ($ million)
Figure 10 Potential re-routing of EU-restricted products 2022Q4 vs. 2021Q4 ($ million)
Source: Trade Data Monitor and dataset on EU sanctions on Russia.
Note: We define potential hubs as non-sanctioning countries that (i) increased exports to Russia by at least $5 million and (ii) increased imports from the EU in 2022 Q4 with respect to 2021 Q4. For Kyrgyzstan available data ends in October 2022, so we excluded it from the sample.
Concluding remarks
Using a unique dataset on the EU trade restrictions on Russia, we provide novel evidence on the impact of trade bans on Russian imports. By exploiting data both from mirror statistics and Russian customs, we obtain robust and comprehensive evidence. We find that the effects of the sanctions on exports to Russia are sizable. Flows from sanctioning countries are still well below their pre-war trend and are close to zero for restricted goods. Even if Russian imports from non-sanctioning countries picked up, they did not replace the missing shipments from sanctioning countries in most sectors. Some countries, especially those traditionally holding strong economic ties with Russia, may have become a hub through which some private companies reroute the products they imported from the EU towards Russia.
References
Babina, T, B Hilgenstock, O Itskhoki, M Mironov and E Ribakova (2023), “Assessing the Impact of International Sanctions on Russian Oil Exports”, VoxEU.org, 20 April.
Borin, A, F P Conteduca and M Mancini (2022), “The Real-time Impact of the War on Russian Imports: A Synthetic Control Method Approach”, SSRN Working Paper 4295989.
Borin, A, E Di Stefano, F P Conteduca, V Gunnella, M Mancini and L Panon (2023), “Trade Decoupling from Russia”, International Economics, forthcoming.
Chupilkin, M, B Javorcik and A Plekhanov (2023), “The Eurasian roundabout: Trade flows into Russia through the Caucasus and Central Asia”, EBRD Working Paper No. 276.
Demertzis, M, B Hilgenstock, B McWilliams, E Ribakova and S Tagliapietra (2022), “How have sanctions impacted Russia”, Bruegel Policy Contribution 18/22.
Garicano, L, D Rohner and B Weder di Mauro (2022), Global Economic Consequences of the War in Ukraine: Sanctions, Supply Chains and Sustainability, CEPR Press.
Simola, H (2022), “War and sanctions: Effects on the Russian economy”, VoxEU.org, 15 December.
