Editors' note: This column is part of the Vox debate on the economic consequences of war.
Russia annexed Crimea in 2014 and launched a full-blown war in Ukraine in 2022. In response, the West imposed a wide range of sanctions, including financial restrictions on Russian banks and firms (for an overview see Berner et al. 2022). The recent debate on the effects of sanctions has been focused on the EU tariffs on Russia’s exports (Latipov et al. 2022), how different nations perceive the sanctions against Russia (i.e. public sentiment, see Ngo et al. 2022), and other topics. However, less is known about how the sanctions affect domestic residents of a targeted country – Russia, in our case. This knowledge is crucial for the proper design of sanctions.
We may expect that the current sanctions have larger negative effects on those economic agents that are less likely to support the political regime in Russia: richer households in big cities, as they may have international assets and are more competitive in international labour markets, and more productive firms, as they are more likely to be well-integrated into the world economy. In contrast, the sanctions are less likely to hit the regime's proponents: poorer households in rural areas and local firms with lower levels of productivity.
We fill this gap in the literature by estimating the effects of a sanction shock on different parts of households and firms using Jorda’s (2005) local projection method. The sanction shock is proxied with a negative shock to the international credit supply that we isolate from the reduced-form residuals of a VAR model of the Russian economy using an appropriate sign restrictions approach (Mamonov and Pestova 2022).
Financial sanctions and the cross-section of firms
We collect firm-level data from the SPARK-Interfax database from 2012 to 2018. We require firms to simultaneously have non-missing non-negative values on total assets, total revenue, value added, number of employees and wages, capital, and intermediate inputs (materials), and bank and non-bank borrowed funds. We also require the firms to operate for at least three consecutive years. The final sample consists of 7,460 large and small firms resulting in 40,381 firm-year observations over the period of 2012-2018. The firms operate in as many as 14 different sectors of the Russian economy (two-digit classification) ranging from natural resources extraction to IT.
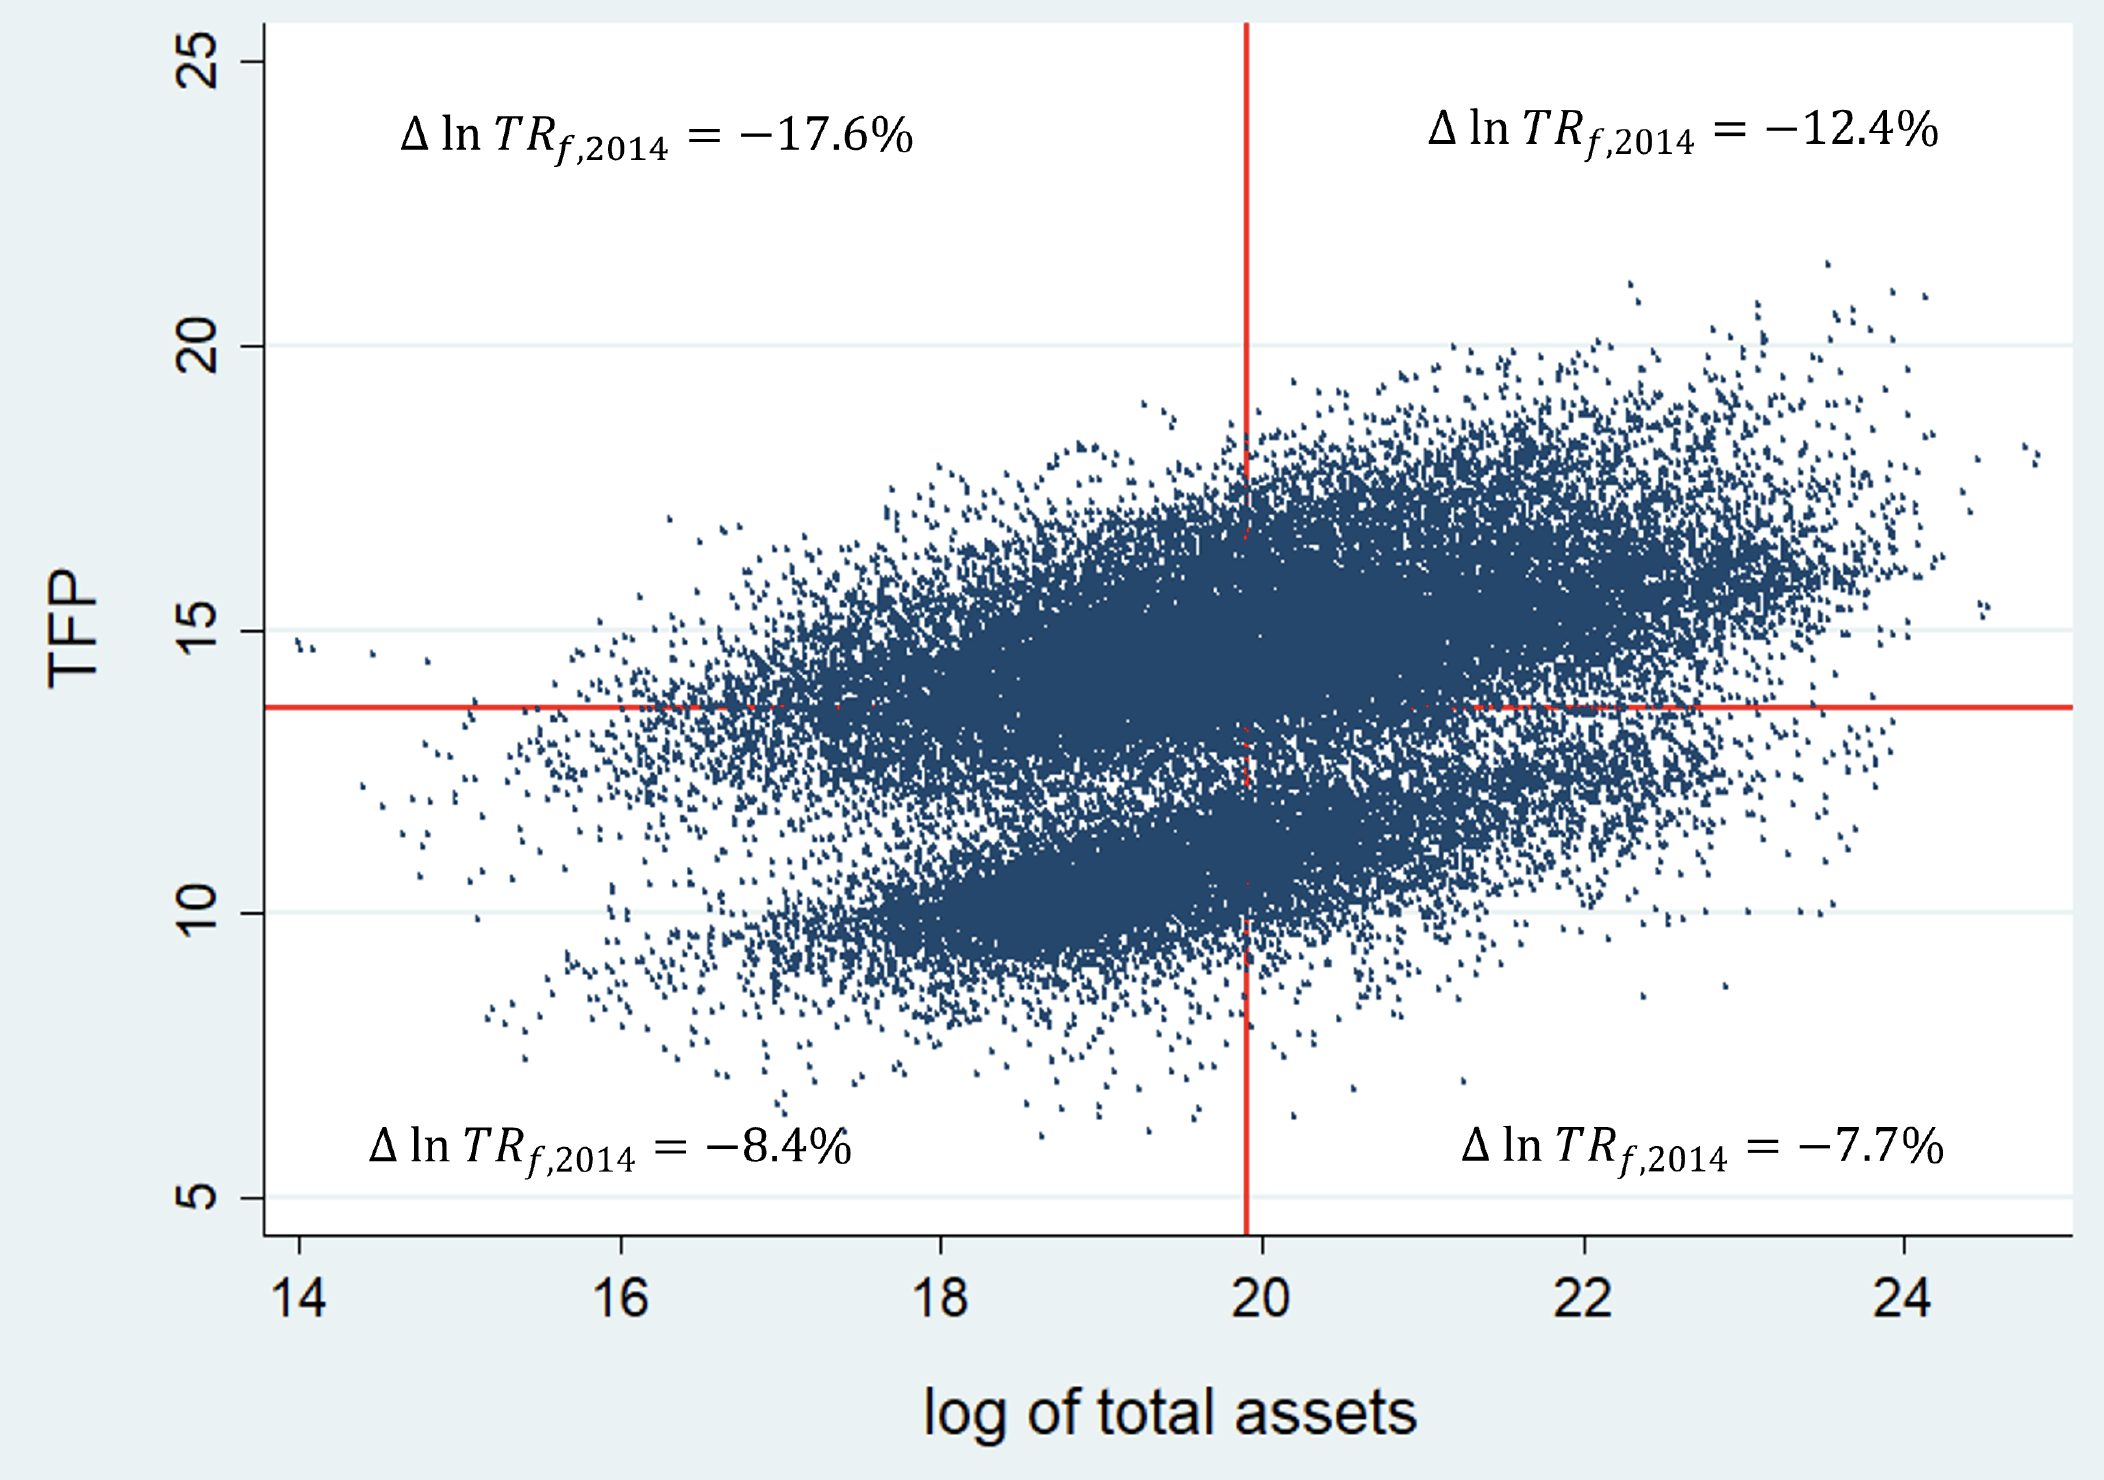
Given the estimated total factor productivity (TFP) for firms and their observed sizes (log of total assets), we divide our sample into four parts: (1) large firms with high TFP (Number of observations = 14,126), (2) large firms with low TFP (5,198 observations), (3) small firms with high TFP (9,684 observations), and (4) small firms with low TFP (11,373 observations). We use the mean value of firms’ total assets to separate ‘large' and ‘small' firms. ‘High' and ‘low' productivity is defined accordingly using the mean value of TFP. Figure 1 visualises the resultant four cells of firm-year observations and reports the growth rate of firms' total revenue (in constant prices) during the first year of the financial sanctions in each of the four cells. We observe that holding firm size constant, more productive firms faced larger declines in real revenues than less productive firms. Consider, for example, large firms: more productive corporations experienced a 12.4% decline in real revenues in 2014, while less productive rivals faced only a 7.7% drop during the same year. Consider now small firms: more productive entities reported a 17.6% slump in real revenues in 2014, while less productive peers had only an 8.4% reduction over the same period. These figures also imply that larger firms were able to better support their revenues than smaller firms, and more so for more productive firms.
Figure 1 Firm size, TFP, and decline of firms’ real income during the first year of sanctions
Source: authors’ estimates
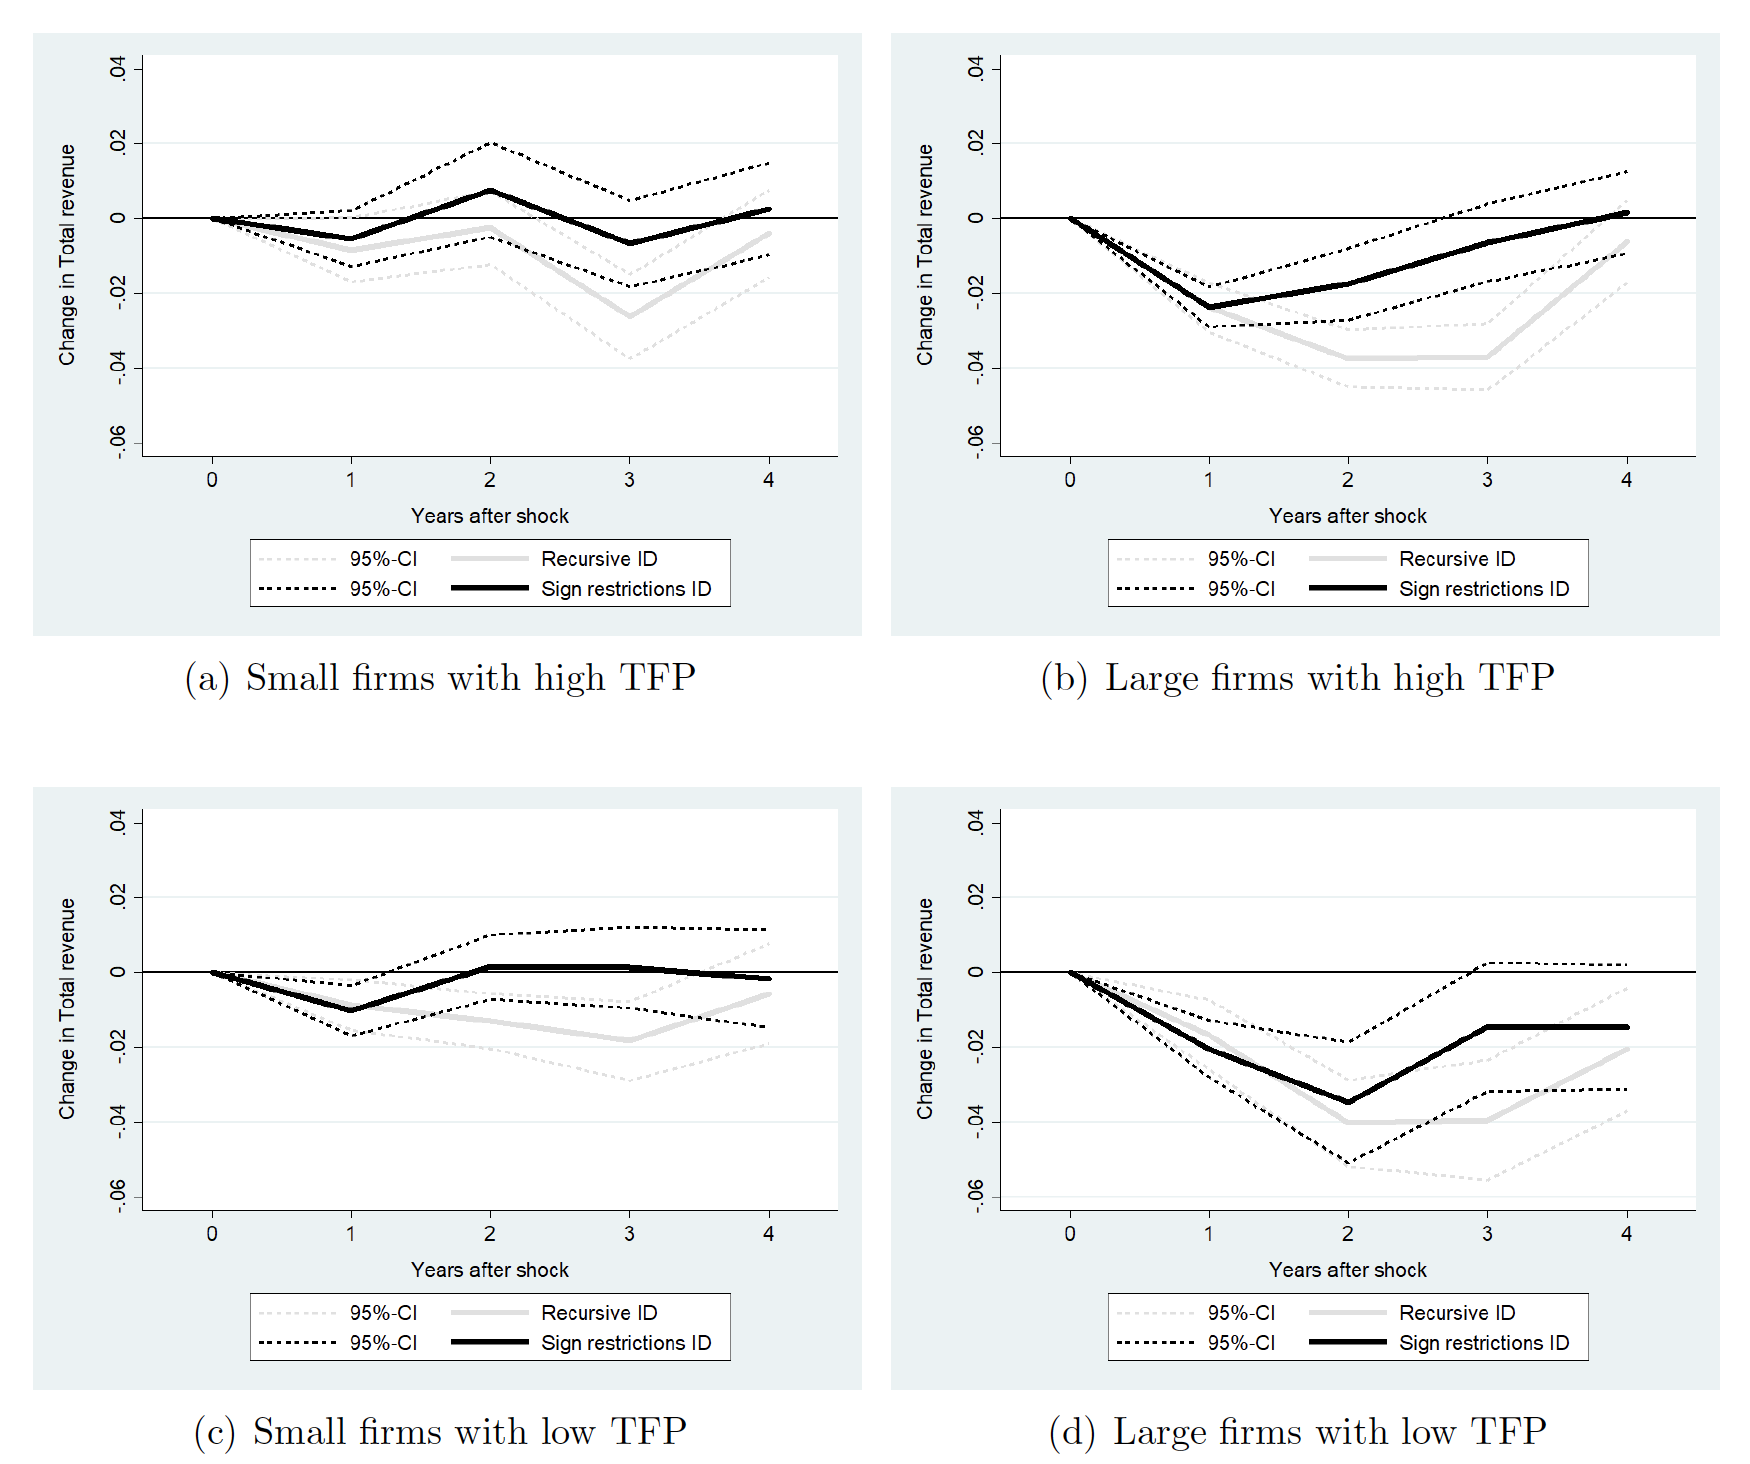
The estimation results appear in Figure 2. The figure contains the same four cells of firms and in the same order as in Figure 1. First, the estimates suggest that during the first year of the financial sanctions shock, the real total revenue of the large firms with high TFP and large firms with low TFP both decline by 2.0–2.2 percentage points. These are equivalent to 16% and 29% of the total decline in real revenues of these firms, respectively. This means the financial sanctions had economically significant effects on the performance of large firms in Russia beyond the effects of the oil price drop and monetary contraction back in 2014. Interestingly, for the large firms with high TFP, the sanctions’ effect starts to decline from the second year, being still significant, whereas the same effect for the large firms with low TFP continues to expand reaching almost –4%. This implies that productivity matters for the absorption of the sanctions’ effect. Starting from the third year, the effect on both types of firms attenuates to zero.
Figure 2 The effects of the sanctions shock on the real total revenue in a cross-section of firms
Source: authors’ estimates.
Second, the estimates indicate that, during the first year after the sanctions shock, the real revenue of the small firms with high TFP decreases by 0.5 percentage points. This decrease, however, is insignificant. And during the second to fourth years after the sanctions shock, the estimated response remains close to zero and insignificant. Qualitatively almost the same results pertain to the group of small firms with low TFP: during the first year after the sanctions shock their real revenue declines by one percentage point (or 12% of the overall decline in 2014), but this effect is much lower than for the large firms and it turns virtually zero from the second year onwards. Strikingly, the small firms experienced much larger total declines in their real revenue than did the large firms (recall Figure 1) but, as our estimates suggest, these declines are barely explained by the sanctions.
Financial sanctions and the cross-section of households
We collect panel data on the Russian households from the RLMS-HSE database, a rich survey of 5,000 Russian households that the National Research University Higher School of Economics has been conducting across Russia since 1994.
We extract the data on income and consumption for the period from 2006 to 2018 and winsorise the data below the 1st and above the 99th percentiles, which results in 21,813 individuals from different households and 74,356 observations in total.
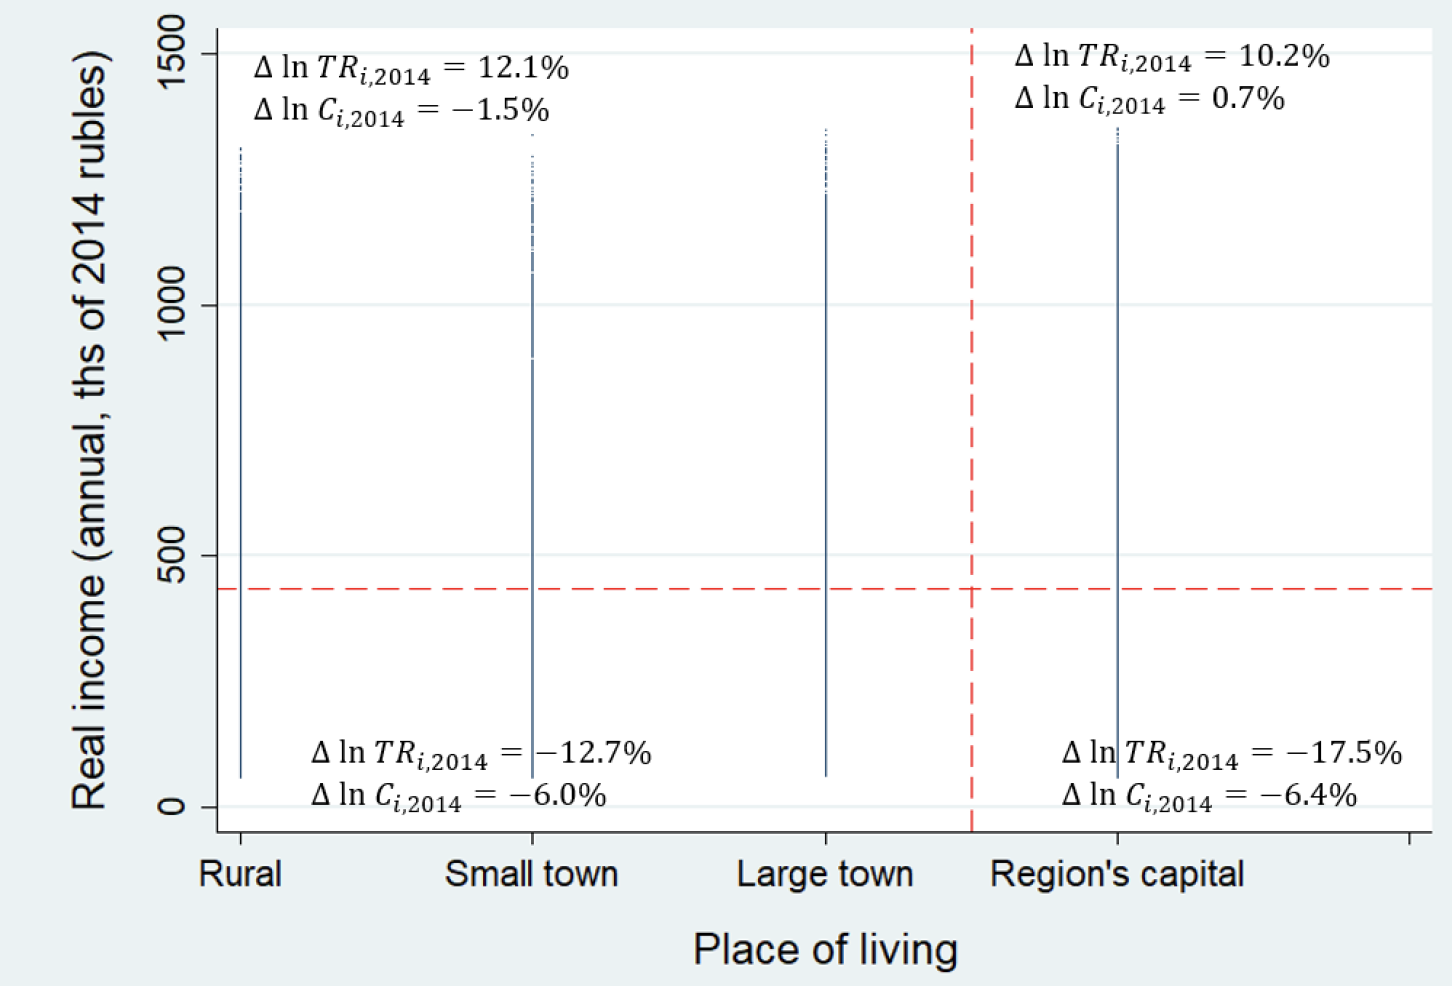
The data allow us to trace the place of living and total income of each individual. It turns out that the breakdown of the 74,356 observations that we have for the analysis is as follows: (1) richer individuals residing in a region’s capital city (31,266 observations), (2) poorer individuals residing in a region’s capital city (20,836 observations), (3) richer individuals residing in regions' other locations (4,460 observations), (4) poorer individuals residing in regions' other locations (17,794 observations). Within these four cells, the raw data show that richer households were facing growing, not declining, income during the first year of sanctions in 2014, whereas poorer households were suffering from a substantial decline in income (Figure 3).
Figure 3 Individuals' income, place of living, and growth rates of the individuals' income and consumption during the first year of sanctions
Source: authors’ estimates.
Richer households
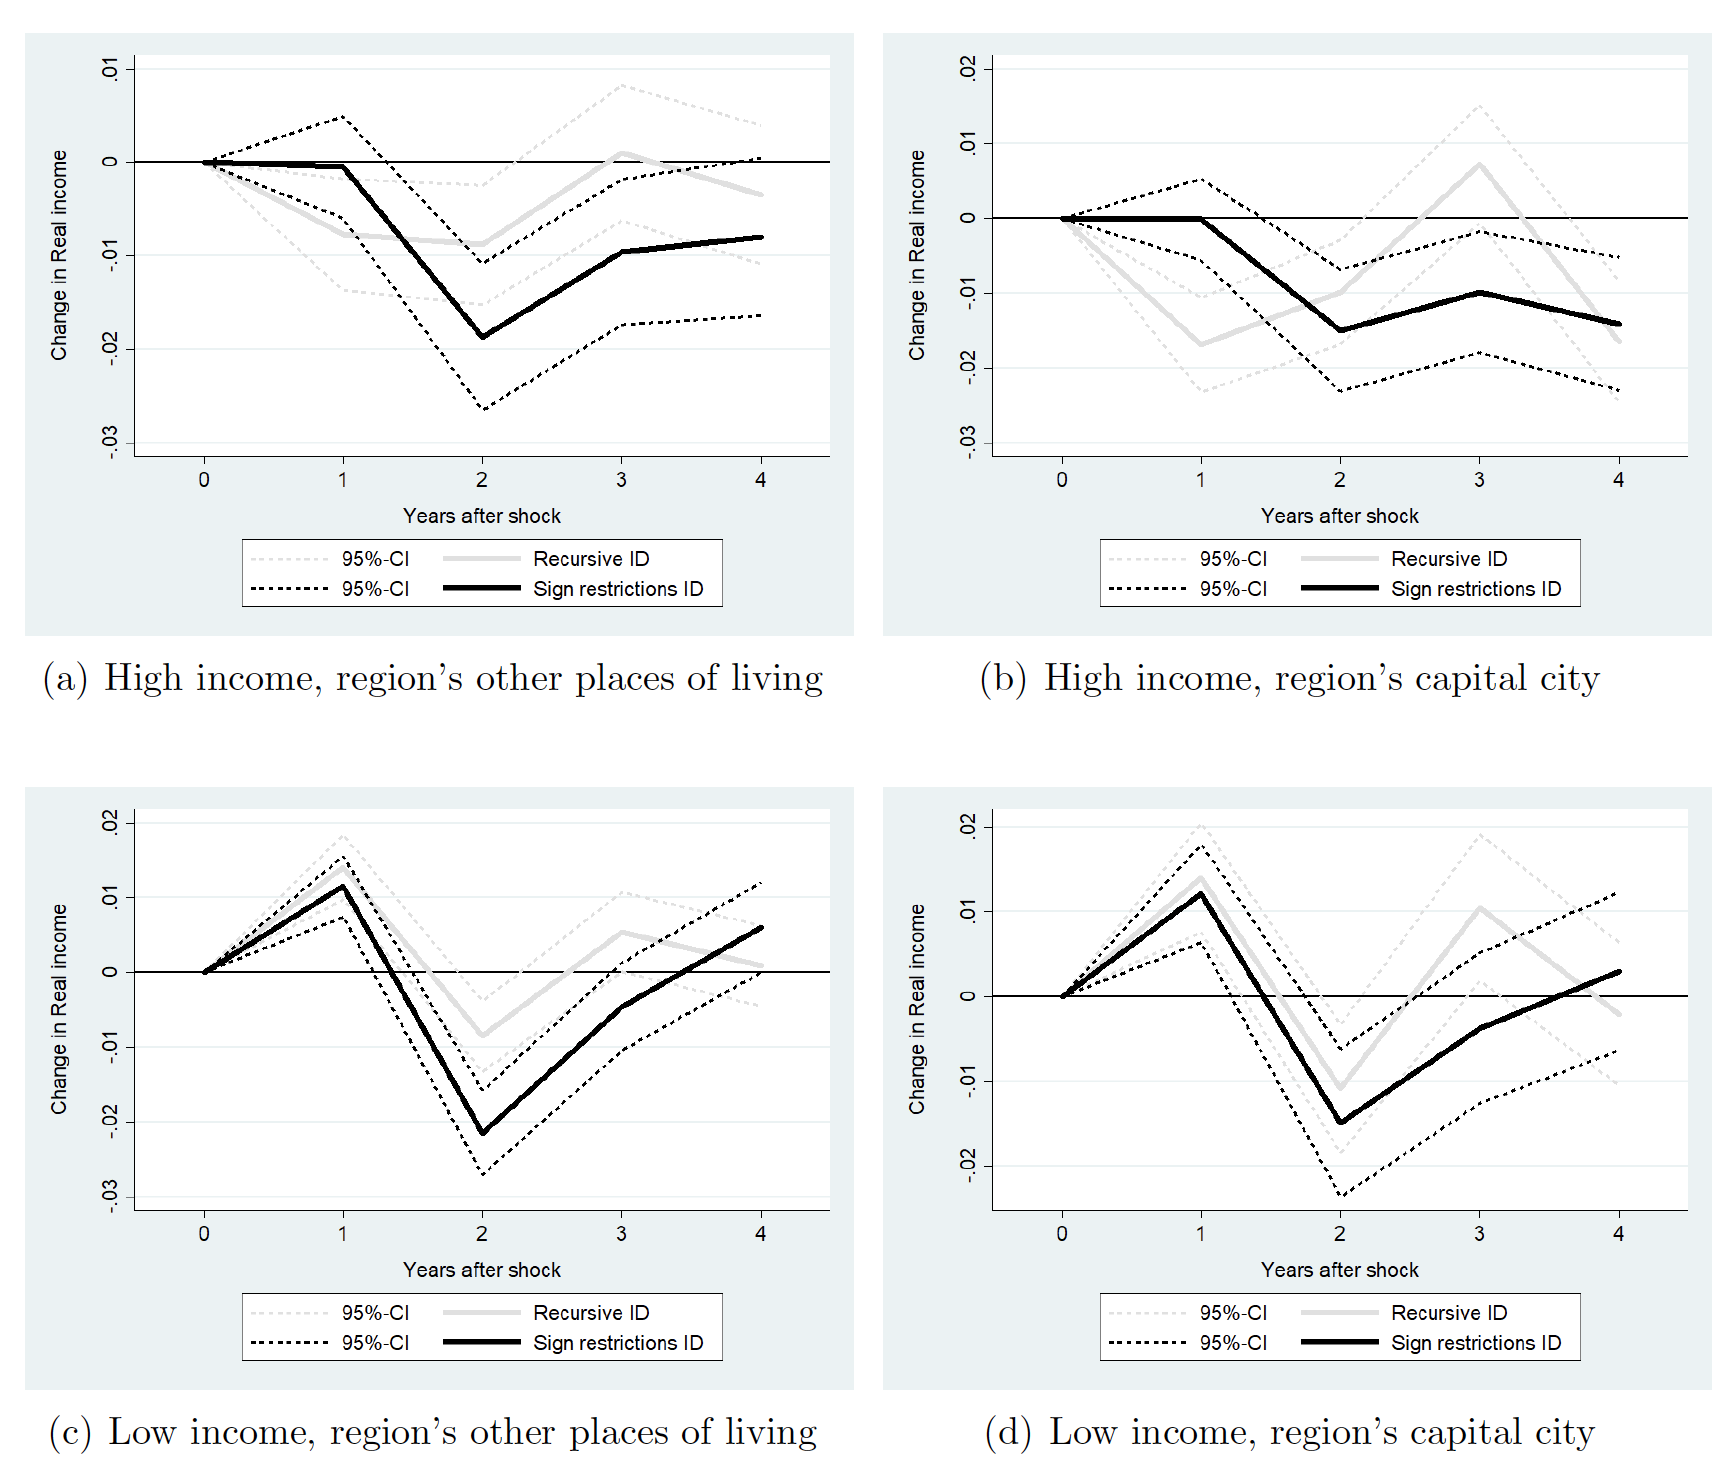
The local projection estimates suggest that the real income of richer households does not respond to the sanctions shock during the first year after the shock occurs (Figure 4). However, during the second year after the shock, the real income declines by 1.5 percentage points, if the households live in regions' capital cities, and by 2.0 percentage points, if they live everywhere else (all estimates are significant at 5%). Interestingly, in regions' capital cities, the effect on real income persists in time, remaining negative and significant even during the third and fourth years after the shock. For the other places of living, by contrast, the effect on real income weakens starting from the third year.
Figure 4 The effects of the sanctions shock on real income in a cross-section of households
Source: authors’ estimates.
Poorer households
Strikingly, the estimates further indicate that the real income of poorer households responds positively, not negatively, to the sanctions shock during the first year (Figure 4). The positive reactions are 1.2 percentage points for the poorer households residing in regions' capital cities and 1.1 percentage points for the poorer households everywhere else (all estimates are significant at 5%). During the second year after the sanctions shock, the reactions, however, flip the sign turning negative, reaching –1.5 and –2.1 percentage points, respectively. The third and fourth years' reactions vanish and become insignificant.
By pooling the results for richer and poorer households together, we argue that the financial sanctions could have an unintended effect of reducing income inequality. An interpretation of these findings can be that the sanctions could have (partly) closed the doors for the international businesses of richer households while forcing the Russian government to support poorer households through the redistribution of income and taxes. The government support channel is established by the micro evidence from the work of Mamonov et al. (2021) and Nigmatulina (2021).
Indeed, recall from our description of the raw data above that richer households enjoyed growing real income in 2014, whereas poorer households suffered from a slump in their income. As Ananyev and Guriev (2018) show, a decline in income causes the destruction of trust in the government in Russia. Moreover, as the findings of Simonov and Rao (2022) suggest, the average consumer of (state-owned) media news in Russia – at least back in the 2010s – has a distaste for pro-governmental ideology. This, when coupled with the declining income of the poorer households, could have produced a large negative unintended effect on the Russian government, which is not what the Kremlin's policy is intended to achieve.
Our findings are in contrast with those of Neuenkirch and Neumeier (2016), who reveal that US sanctions were typically leading to a rising poverty gap in the sanctioned countries in the past, i.e. before the Crimea-related restrictions. These authors, however, did not account for the potential support of the poorer population by the sanctioned government. The unintended effect of reducing income inequality that we find is, however, unlikely to persist over time, since our estimates show that the positive effect on the poorer households lasted for only one year.
References
Ananyev, M and S Guriev (2018), “Effect of Income on Trust: Evidence from the 2009 Economic Crisis in Russia”, Economic Journal 126(619): 1082–1118.
Berner, R, S Cecchetti and K Schoenholtz (2022), “Russian sanctions: Some questions and answers”, VoxEU.org, 21 March.
Jorda, O (2005), “Estimation and Inference of Impulse Responses by Local Projections”, American Economic Review 95(1): 161-182.
Latipov, O, C Lau, K Mahlstein and S Schropp (2022), “The economic effects of potential EU tariff sanctions on Russia”, VoxEU.org, 30 September.
Levinsohn, J and A Petrin (2012), “Measuring Aggregate Productivity Growth Using Plant-Level Data”, The RAND Journal of Economics 43(4): 705–725.
Mamonov, M and A Pestova (2022), “The Price of War. Macroeconomic and Cross-Sectional Effects of Sanctions on Russia”, SSRN Working Paper 4190655.
Mamonov, M, S Ongena and A Pestova (2021), “’Crime and Punishment?’ How Russian Banks Anticipated and Dealt with Global Financial Sanctions”, CEPR Discussion Paper 16075.
Ngo, V M, T L D Huynh, P V Nguyen and H H Nguyen (2022), “Public sentiment towards economic sanctions in the Russia–Ukraine war”, VoxEU.org, 11 September.
Nigmatulina, J (2021), “Misallocation and State Ownership: Evidence from the Russian Sanctions”, Mimeo.
Neuenkirch, M and F Neumeier (2016), “The Impact of US Sanctions on Poverty”, Journal of Development Economics 121: 110–119.
Simonov, A and J Rao (2022), “Demand for Online News under Government Control: Evidence from Russia”, Journal of Political Economy 130(2): 259–309.
Wooldridge, J M (2009), “On Estimating Firm-Level Production Functions Using Proxy Variables to Control for Unobservables”, Economics Letters 104(3): 112–114.
Yakovlev, E (2018), “Demand for Alcohol Consumption in Russia and its Implication for Mortality”, American Economic Journal: Applied Economics 10(1): 106–149.
