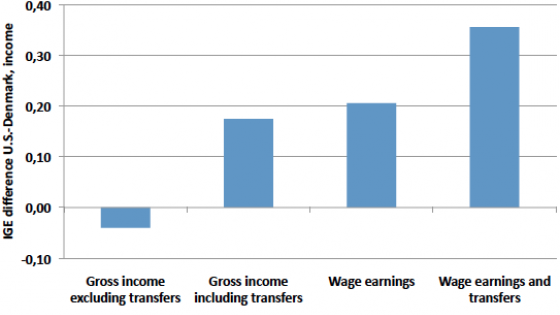
Equality of opportunity for children is a central issue in social policy (e.g. Vandivier 2013, White House 2021) and in academic research. Following pioneering work by Becker and Tomes (1979, 1986), a large and active literature examines this issue by estimating intergenerational mobility in income (e.g. Aaronson and Mazumder 2008, Chetty et al. 2014, Corak 2013, Solon 1992).
Studies typically rely on average incomes of parents and children, measured over common but limited age ranges. This approach, however, does not well capture aspects of lifetime income, such as uncertainty and timing within receipt over the life cycle. In addition, this practice fails to account for changes in the timing of key life events and income trajectories across generations.
Our study (Eshaghnia et al. 2022) shows that this traditional approach gives an incomplete account of intergenerational mobility. We develop new measures that capture the long-run intergenerational transmission of family influence. We estimate them using full population data from Denmark with intergenerational links in income, assets, education, and consumption.
We find that intergenerational mobility is substantially overstated in the traditional approach. Moreover, the bias is greatest for children growing up in disadvantaged conditions.
A new and more nuanced look at social mobility
Our study starts from the simple observation that family resources consist of much more than just average income over a limited age range. Life-cycle income trajectories of individuals differ in ways that simple averages do not capture. Uncertainty about what happens in the future is an important determinant of lifetime welfare.
We develop measures of anticipated lifetime resources that individuals expect at each age. We account for the vast changes across successive cohorts in the timing of key life events, such as participation in education, marriage, and the onset of fertility that have occurred over the past 50 years. We also account for the loss of individual wellbeing due to uncertainty or constraints in borrowing against future income.
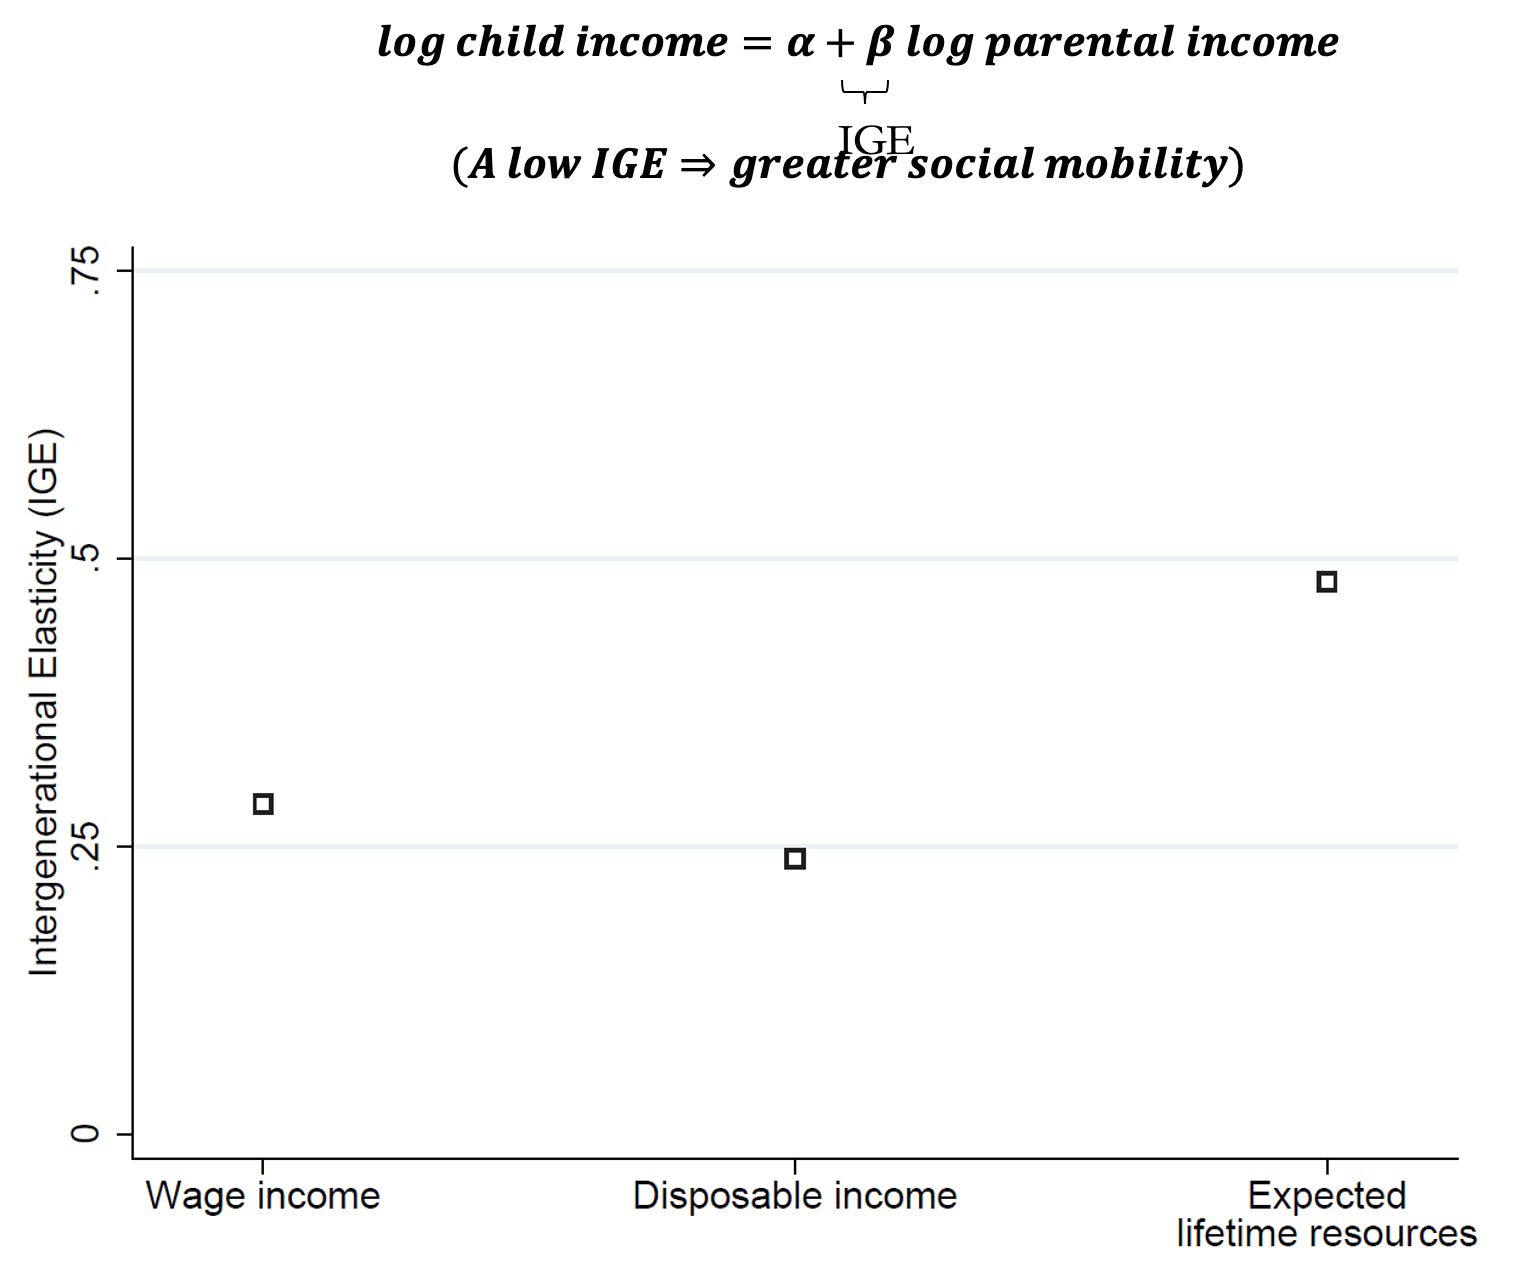
Figure 1 shows how our measures of intergenerational mobility compare to traditional measures. The figure shows estimates of intergenerational elasticities: the percentage increase in child resources when parental resources increase by one per cent. If we focus on resources measured by wage income or disposable income at ages 30–35 in both the parents’ generation and child’s, estimates are around 0.3 (i.e. a 10% increase in parents’ income is associated with a 3% increase in the child’s income). Focusing instead on the lifetime resources that an individual can expect, the estimate is around 0.5.
Figure 1 Intergenerational mobility: traditional measures vs expected lifetime resources
Notes: The figure shows intergenerational elasticities (IGE) estimates for wage income, disposable income, and expected lifetime resources. An estimate of 0.3 implies that a 10% increase in parents’ resources is associated with a 3% increase in children’s resources, on average. The figure is based on register data from Denmark for cohorts born in 1981 and 1982 and their parents.
Mobility has been overstated. This is most pronounced for children from disadvantaged families. For children at the 5th percentile of household resources, for example, a 10% increase in parents’ disposable income is associated with a 0.5% increase in a child’s disposable income, suggesting a high level of intergenerational mobility. Yet, when we study anticipated lifetime resources, we find that for the same group of children, the corresponding estimate is around ten times higher than for disposable income.
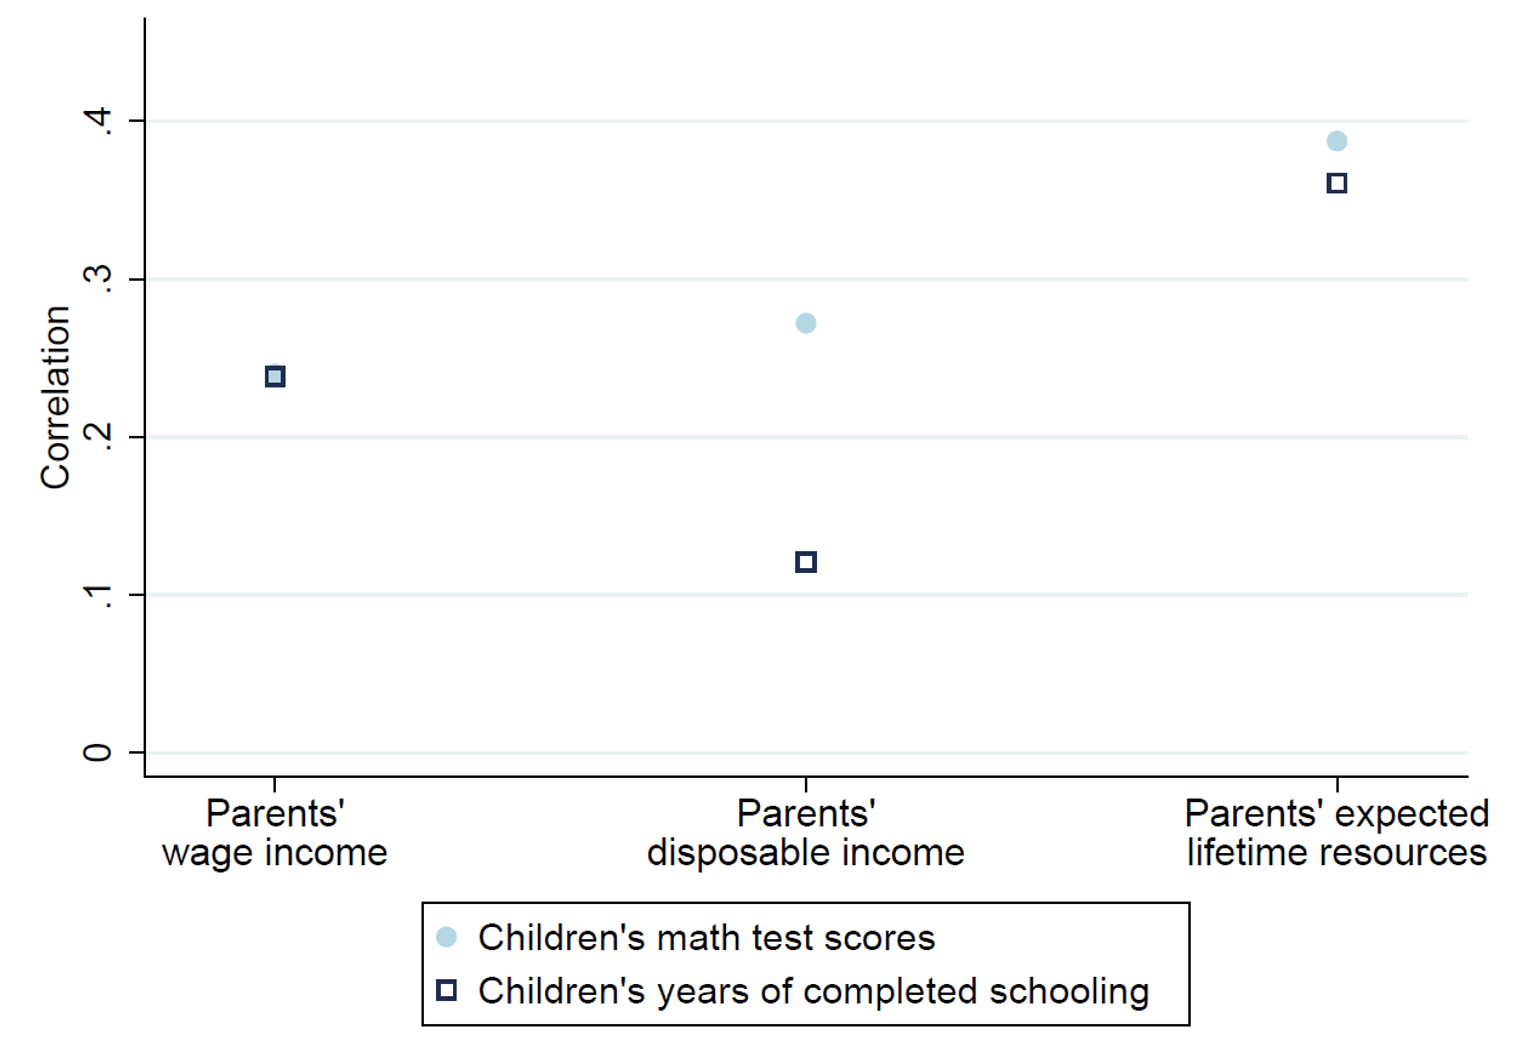
Our findings extend to other aspects of a child’s life. Figure 2 shows the association between parents’ resources and children’s math test scores and their years of completed schooling. We find similar results if we consider test scores for language skills, completion of specific education levels such as college, and risk behaviours such as crime and teen pregnancy (not shown in the figure).
Figure 2 Parents’ resources and children’s outcomes
Notes: The figure shows the association between parents’ wage income, disposable income, and expected lifetime resources, and children’s math test scores and years of completed schooling. The measure of association is a correlation coefficient. The figure is based on register data from Denmark for cohorts born in 1981 and 1982 and their parents.
Across the board, we see a much stronger link between parents and children. The traditional analysis of family resources, such as average income at a common set of narrowly defined ages, understates intergenerational dependence by 50%.
Expected or realised resources?
Parents do not know with certainty what the family income will be in the future, whether there will be unemployment spells, or how well they can smooth income and consumption. We estimate age-by-age expectations and see how well they predict important lifetime outcomes.
Previous research (e.g. Cunha and Heckman 2007, Heckman and Mosso 2014, Tominey et al. 2020) shows that the timing of parental investment in children matters greatly. Our study extends these findings by focusing directly on uncertainty and the role of parental expectations about the future at key stages of child development.
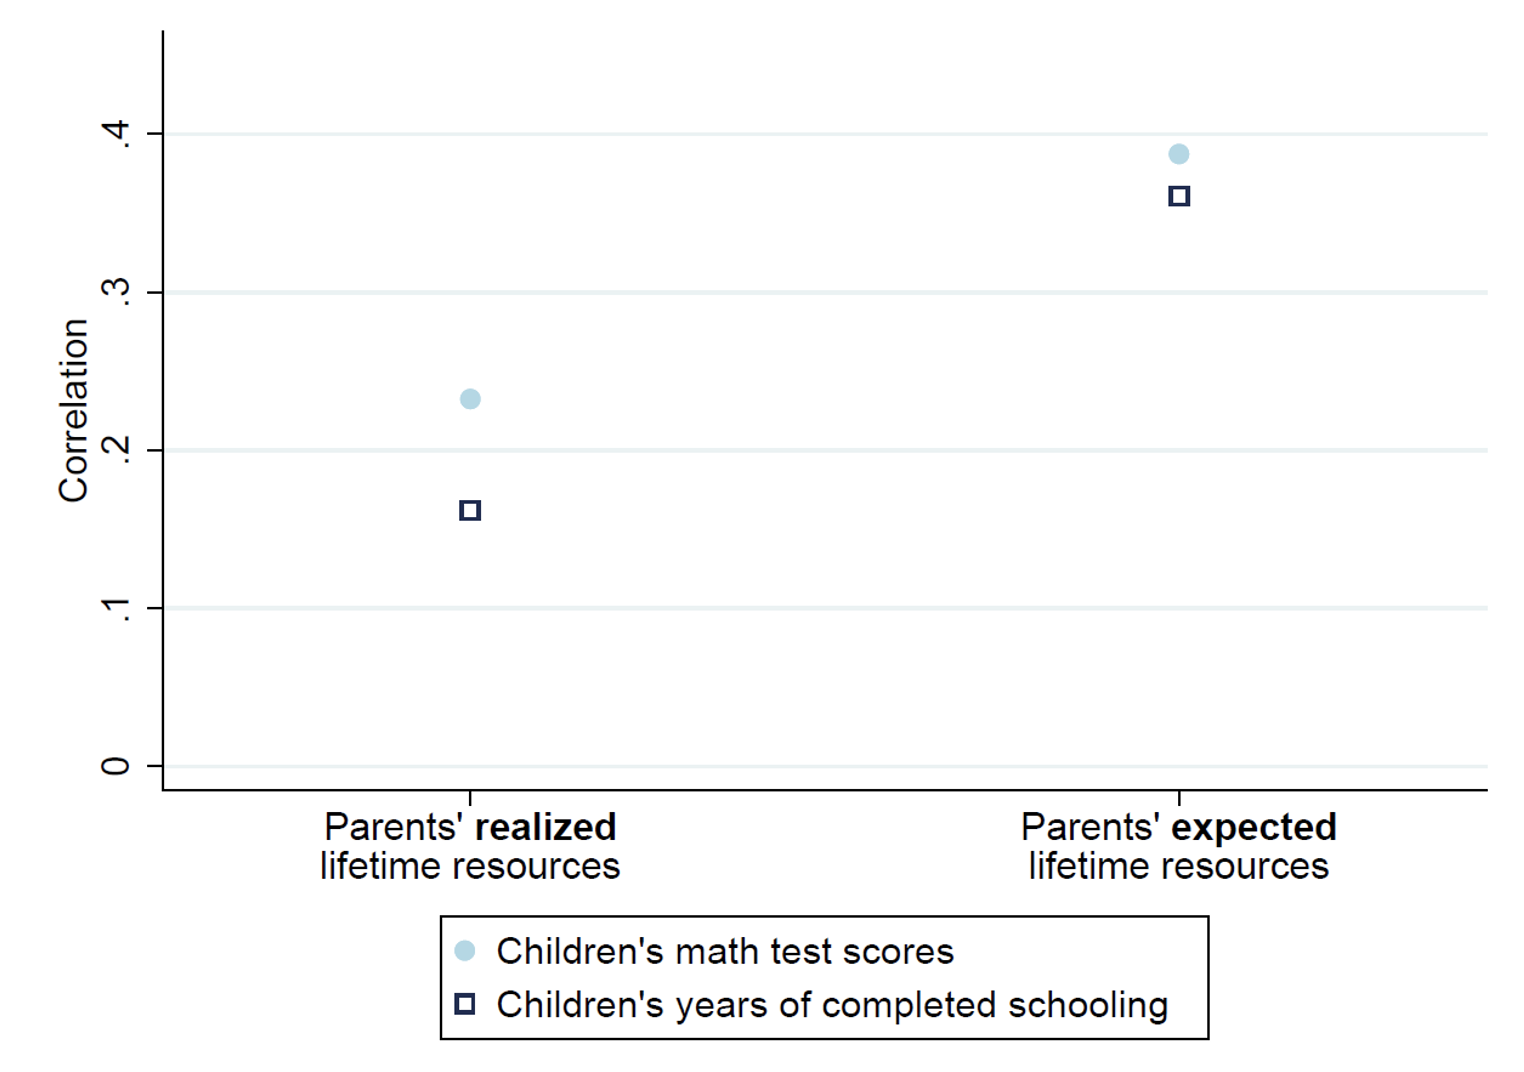
Figure 3 compares the predictive power of parental expected lifetime resources when their children are young on math test scores and years of completed schooling. The figure shows that expected lifetime resources better predict child outcomes than realised resources. This is so because parents choose how much to invest in their children based on their expected (yet-to-be-realised) incomes, and not the later realised incomes used in previous research.
Figure 3 Parents’ expected vs realised lifetime resources and children’s outcomes
Notes: The figure shows the association between parents’ expected and realised lifetime resources, and children’s math test scores and years of completed schooling. The measure of association is a correlation coefficient. The figure is based on register data from Denmark for cohorts born in 1981 and 1982 and their parents.
The role of education
To better understand the mechanisms generating the stronger association between parents and children for expected lifetime measures, we examine components of family background. Research in Norway and Denmark shows that wealthy individuals tend to marry wealthy spouses (Guiso and Pistaferri 2022), and affluent parents transfer wealth to children even at early ages (e.g. Boserup et al. 2016). We find that differences in educational attainment drive most of the persistence in expected lifetime resources as well as wellbeing across generations.
In contrast, when we perform a similar analysis using traditional measures, we find that little of the estimated persistence is accounted for by education, family formation, or labour market experience. This large unexplained component raises the question of what the estimates that guided the previous large literature and many policy discussions reflect.
Current generations are better off
So far, we have focused on relative mobility: a child’s position relative to his/her peers of the same age. A different question – also of great interest to public policy – is whether current generations are better off than previous ones. This notion of social mobility is called absolute mobility.
While our findings suggest that conventional measures overstate relative mobility, they turn out to underestimate absolute mobility. Children’s prospects are better than those faced by their parents. This is a consequence of changing life-cycle dynamics and economic conditions. Recent cohorts acquire more education and marry and form families later, face less uncertainty about unemployment, and have easier access to credit, which helps to smooth consumption across the life cycle.
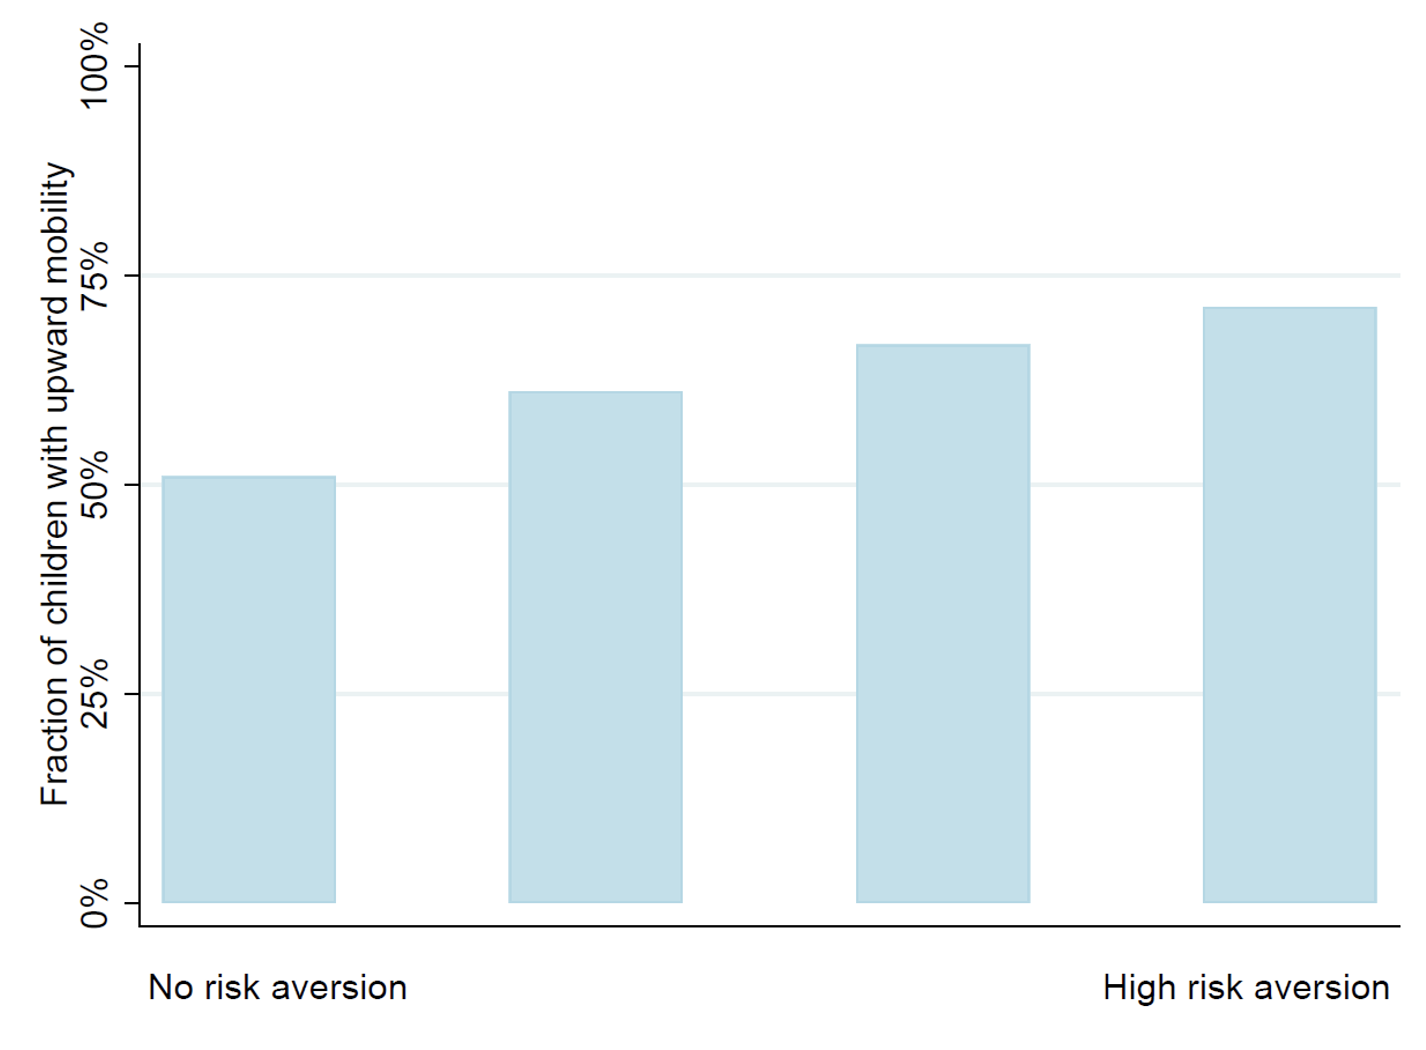
Figure 4 illustrates the role of changes in access to credit and the amount of uncertainty across generations in absolute mobility. The figure shows the fraction of children with higher expected lifetime resources than their parents, assuming different levels of risk aversion. The first bar, ‘risk neutral’, shows that if we ignore uncertainty – as is done in the traditional literature – 60% of the younger generation have higher expected lifetime resources than their parents. As we increase risk aversion, this fraction increases. Moving from left to right in the figure, we see that absolute mobility increases to a level where around 80% of children have higher expected lifetime resources than their parents. Estimates of risk aversion for Denmark (Szpiro 1986) suggest it is substantial.
Figure 4 Absolute mobility in expected lifetime resources for different levels of risk aversion
Notes: The figure shows the fraction of children with expected lifetime resources that are higher than their parents’, for different levels of risk aversion. The bar to the left corresponds to risk neutrality (i.e. when individuals are indifferent to risk). Moving from left to right, the figure considers mobility for increasing levels of risk aversion. The figure is based on register data from Denmark for cohorts born in 1981 and 1982 and their parents.
Future directions
Applying economic theory to data on individual and family life-cycle dynamics gives a deeper understanding of social mobility and the mechanisms shaping it. Our approach allows for a better understanding of how intergenerational mobility can be shaped by factors such as the family, changes in individual life cycles across generations, uncertainty, credit constraints, and the expectations and trajectories individuals face across their lifetimes.
Our broader view of resources and wellbeing shows that even in a generous welfare state such as Denmark, with substantial social insurance and redistribution through taxes and transfers, there is strong intergenerational dependence – even beyond what our previous research has suggested (see Landersø and Heckman 2016). These findings call for a deeper examination of the sources of inequality and its persistence across generations.
References
Aaronson, D, and B Mazumder (2008), “Intergenerational economic mobility in the US, 1940 to 2000”, Journal of Human Resources 43(1): 139–72.
Becker, G S, and N Tomes (1979), “An equilibrium theory of the distribution of income and intergenerational mobility”, Journal of Political Economy 87(6): 1153–89.
Becker, G S, and N Tomes (1986), “Human capital and the rise and fall of families”, Journal of Labor Economics 4(3, Part 2): S1–S39.
Boserup, S, W Kopczuk and C T Kreiner (2016), “Danish evidence on wealth inequality childhood”, VoxEU.org, 4 November.
Chetty, R, N Hendren, P Kline and E Saez (2014), “Where is the land of opportunity? The geography of intergenerational mobility in the US”, Quarterly Journal of Economics 219(4): 1553–623.
Corak, M (2013), “Income inequality, equality of opportunity, and intergenerational mobility”, Journal of Economic Perspectives 27(3): 79–102.
Cunha, F, and J J Heckman (2007), “The technology of skill formation”, American Economic Review 97(2): 31–47.
Eshaghnia, S, J J Heckman, R Landersø and R Qureshi (2022), “Intergenerational transmission of family influence”, NBER Working Paper 30412.
Guiso, L, and L Pistaferri (2021), “Assortative mating and the wealth inequality debate”, VoxEU.org, 14 May.
Heckman, J J, and S Mosso (2014), “The economics of human development and social mobility”, Annual Review of Economics 6(1): 689–733.
Landersø, R, and J J Heckman (2016), “The Scandinavian fantasy: The sources of intergenerational mobility in Denmark and the US”, VoxEU.org, 12 September.
Solon, G (1992), “Intergenerational income mobility in the US”, American Economic Review 82(3): 393–408.
Szpiro, G G (1986), “Measuring risk aversion: an alternative approach”, Review of Economics and Statistics 156–59.
Vandivier, D (2013), “What is the Great Gatsby Curve?”, The White House, 11 June.
The White House (2021), “Build Back Better Framework”, The White House, 23 October.
Tominey, E, P Carneiro, I L Garcia and K Salvanes (2020), “Intergenerational mobility and the timing of parental income”, Journal of Political Economy.


