That China is in the news more often than other countries – for the good and the bad – shouldn’t surprise us, given its size in virtually everything measurable. However, what is startling about the country is its speed of catching-up since it opened to the global economy in 1978.
It is undoubted that one major driver of the change has been global market access from both a narrow (trade and direct investment) and a broad point of view (learning through imitation and innovation by exposure to foreign frontier products). However, China’s own efforts in this process should not be overlooked. On top of its increased global market access (for example, through reduced applied tariffs and reduced tariff uncertainty), the change in market access of its producers to global market access points (i.e. ports) as well as to domestic customers should not be underestimated. An instrumental factor to both has been the change in transport infrastructure within China. Leaving aside the waterways and air transport infrastructure, the growth of China’s domestic road and railway network is nothing short of dazzling.
While it has been remarked before that China constitutes a role model in developing highway and high-speed railway networks (Faber 2014, Baum-Snow et al. 2017, Barwick et al. 2018), these developments constitute only part of China’s transport infrastructure growth. It may come as a surprise to many of us who rely on the general positioning system (GPS) when riding bicycles or motorcycles, driving cars, or even when walking that, for many countries – including developed ones – detailed statistics on the size, quality, and location of the wider road and railway networks are difficult to obtain. In particular, this is the case when thinking of time-series data. Who could tell easily how long it took to travel by car or train between the following pairs of cities in 2015 versus 2000: from Iserlohn in the state of North Rhine-Westphalia to Cham in the state of Bavaria (both in Germany); from Meursault in Burgundy to St. Emilion in Gironde (both in France); from Urbino in Marche to Potenza in Basilicata (both in Italy); or from Cuenca in Castile-La Mancha to Càceres in Extremadura (both in Spain)? Answering these questions requires knowledge of the multi-layer road and railway infrastructure, the quality of each line, and the statutory speed limits. This information is hard to obtain at any moment in time in general, and it is even more difficult for countries such as China.
Measuring the dazzling growth of China’s transport infrastructure network
In a recent paper (Egger et al. 2020), we collected 14 yearly road atlases for China between 2000 and 2013, and digitised three layers of its road system (national highways, provincial roads, and prefecture-level roads) and two layers of railways (high-speed and standard railway lines). We combined this information on the location and quality of the network layers with information on statutory speed limits for roads and actual average travel speeds for trains. We also recorded whether and how each connection could be used for the transport of people and goods. Since we know stylised facts about the choice of railway versus road for trips by people and goods depending on the travel time between locations (Wang et al. 2014), this enables us to computing travel times for virtual trips between all locations in China for both people and goods over time. It provides an account of the (domestic and foreign) ‘connectivity’ of locations in China with each other as well as with the rest of the world (when considering major seaports and overseas transport to foreign countries).
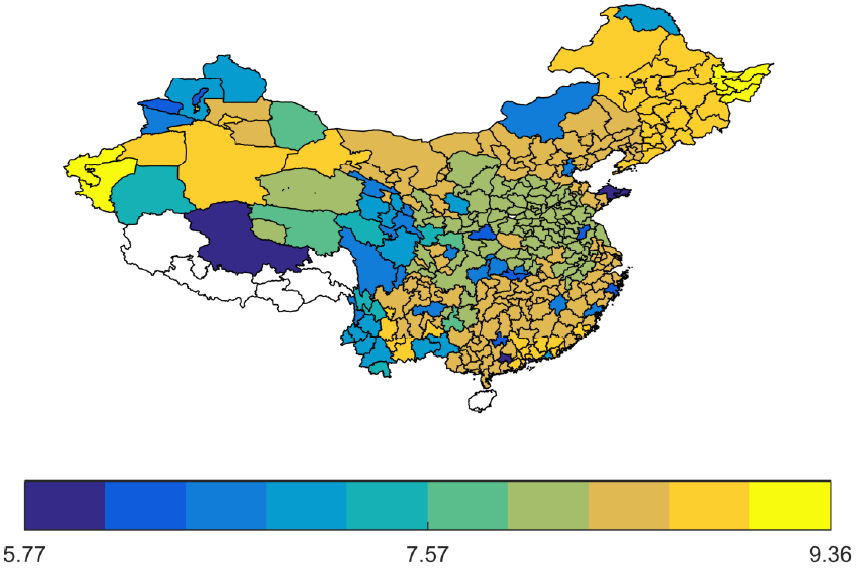
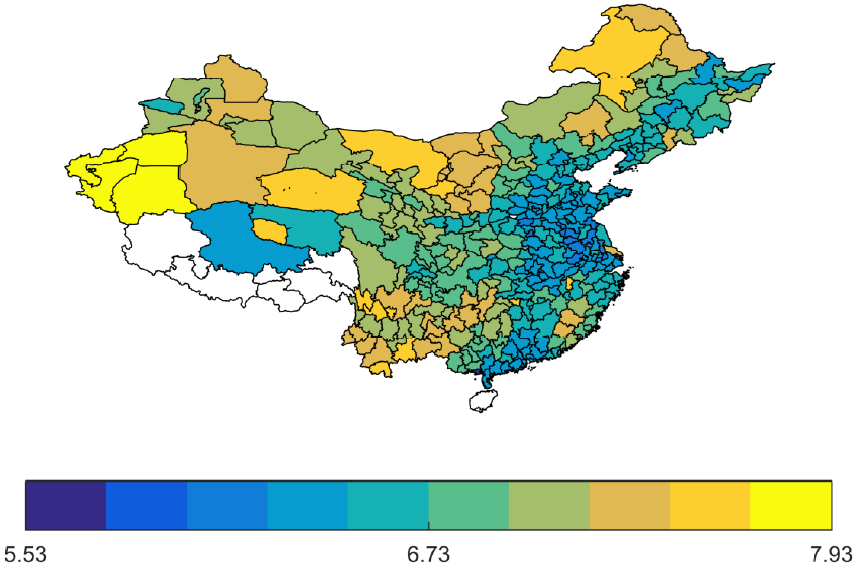
In our paper, we document that the total number of kilometres of highways in China (including the National Trunk Highway System) grew from 50,127 kilometres in 2000 to 142,983 kilometres in 2013. This addition to the Chinese highway system alone is 20% longer than the entire US Interstate Highway System. Similarly, the total length of Chinese regional roads increased by 21%, which is particularly important for short-distance journeys and when it comes to providing access to the highway and railway systems. The construction of 12,996 kilometres of high-speed-railway (HSR) lines between 2008 and 2013 constituted a striking change to the Chinese railway network. In addition, 20,141 kilometres of new standard-railway lines were constructed between 2000 and 2013. All these changes meant that, within 14 years, the average travel time between an arbitrary pair of Chinese prefectures declined by 13% for goods and by 50% for people. Figure 1 displays the reduction in the sum of travel times to all other Chinese prefectures and the rest of the world between 2000 and 2013 (in log hours) for prefectures, excluding those in the southwest for data reasons. The pattern attests to a majestic gain in terms of China’s market access to itself.
Figure 1 Reduction in the sum of bilateral travel times, 2000-2013 (log hours)
a) For people
b) For goods
Economic effects of the Chinese transport infrastructure growth
How can we put an economic value tag on this change? Doing so requires a model which is quantitative in capturing major aspects of the economically relevant heterogeneity across, for example, the prefectures in China. We consider, apart from China’s aforementioned overland transport network, its population (which is treated as mobile across prefectures), its productivity (which is also partly endogenous and differs across prefectures), and its land endowment (which varies across prefectures and can ‘productively’ be used for either commerce or housing). The transport network plays a four-pronged role in this: it facilitates (i.e. lowers the cost of) goods transport to and from prefectures; it facilitates people’s mobility between prefectures regarding residence choices; it facilitates technology spillovers between prefectures; and it facilitates the access to amenities (e.g. nature) for people, which reduces the need to have those amenities available exactly at the residence.
Our model is calibrated to fit China’s economic geography in the year 2000. Parameters mapping travel times into some form of costs are key. This requires acknowledging the endogeneity of transport networks, as network planners aim to reduce transport costs by implementing new or improving existing transport lines. We address this issue by relying on insights from the mathematics of optimal transport and China’s geography alone as well as on historical courier routes used in the Ming dynasty (1368-1644).
A key finding is that the infrastructure improvements (through greater length and quality) lead to a relative convergence of population density and, to a lesser extent, of real per-capita incomes across China relative to a no-change long-run equilibrium. The reason is that the network changes – in particular, to the regional road and the standard-railway system – connect what were originally relatively remote and less central prefectures to the improved, faster networks. This provides them with better access to China's economically central prefectures and to the rest of the world. Two components generate most of this change: reduced goods-transport costs and a greater diffusion of technology along the infrastructure network.
References
Barwick, P, D Donaldson, S Li, and Y Lin (2018), “The Welfare Effects of Passenger Transportation Infrastructure: Evidence from China,” unpublished Manuscript.
Baum-Snow, N, L Brandt, J V Henderson, M A Turner, and Q Zhang (2017), “Roads, Railroads, and Decentralization of Chinese Cities,” The Review of Economics and Statistics 99: 435–448.
Egger, P, G Loumeau and N Loumeau (2020), “China’s Dazzling Transport-infrastructure Growth: Measurement and Effects,” CEPR Discussion Paper 15372.
Faber, B (2014), “Trade Integration, Market Size, and Industrialization: Evidence from China’s National Trunk Highway System,” The Review of Economic Studies 81: 1046–1070.
Wang, Y, L Li, L Wang, A Moore, S Staley, and Z Li (2014), “Modeling traveler mode choice behavior of a new high-speed rail corridor in China,” Transportation Planning and Technology 37: 466–483.


