High and rising inflation is eroding the purchasing power of households. As of August 2022, the harmonised index of consumer prices (HICP) has reached or approached double-digit levels in the EU (10.1%) and the euro area (9.1%), and surpassed 20% in several Baltic and Eastern European member states.
Such extreme price changes are expected to be short-lived, but upside risks to longer-term and persistent inflation remain greater than usual (Uzeda et al. 2022).
Since current inflation is driven mainly by soaring food and energy prices, households in low-income EU countries or with below-median income are impacted more strongly, due to higher relative spending on essential items and less elastic consumer demand. This inequality aspect of inflation traditionally received little scholarly attention. More recently, however, multiple attempts aimed at measuring the gap between the effective inflation rates experienced by low-income and high-income households (Kaplan and Schulhofer-Wohl 2017, Gürer and Weichenrieder 2020, Claeys and Guetta-Jeanrenaud 2022, Villani and Vidal Lorda 2022). Despite differences in scope, data and methodology, these studies confirm the existence of inflation gaps of multiple percentage points – the highest figures in Europe for decades (Charalampakis et al. 2022).
My new study at the Joint Research Centre (JRC) of the European Commission takes a detailed view of European households’ expenditure patterns in order to answer this question in a comprehensive manner (Menyhért 2022).
Using microdata from the latest available wave of the EU Household Budget Survey (EU-HBS) from 2015, I analyse consumer spending between and within main product categories (such as food, energy, industrial goods and services) across the EU. The study confirms that households in low-income Member States or with below-median income may devote twice as high a share of their total budget to food and energy relative to higher-income segments of the European population. Specifically, the combined expenditure share of food and energy ranges from 23% to 66% across EU countries, and differs by up to 20 percentage points between income quintiles within countries.
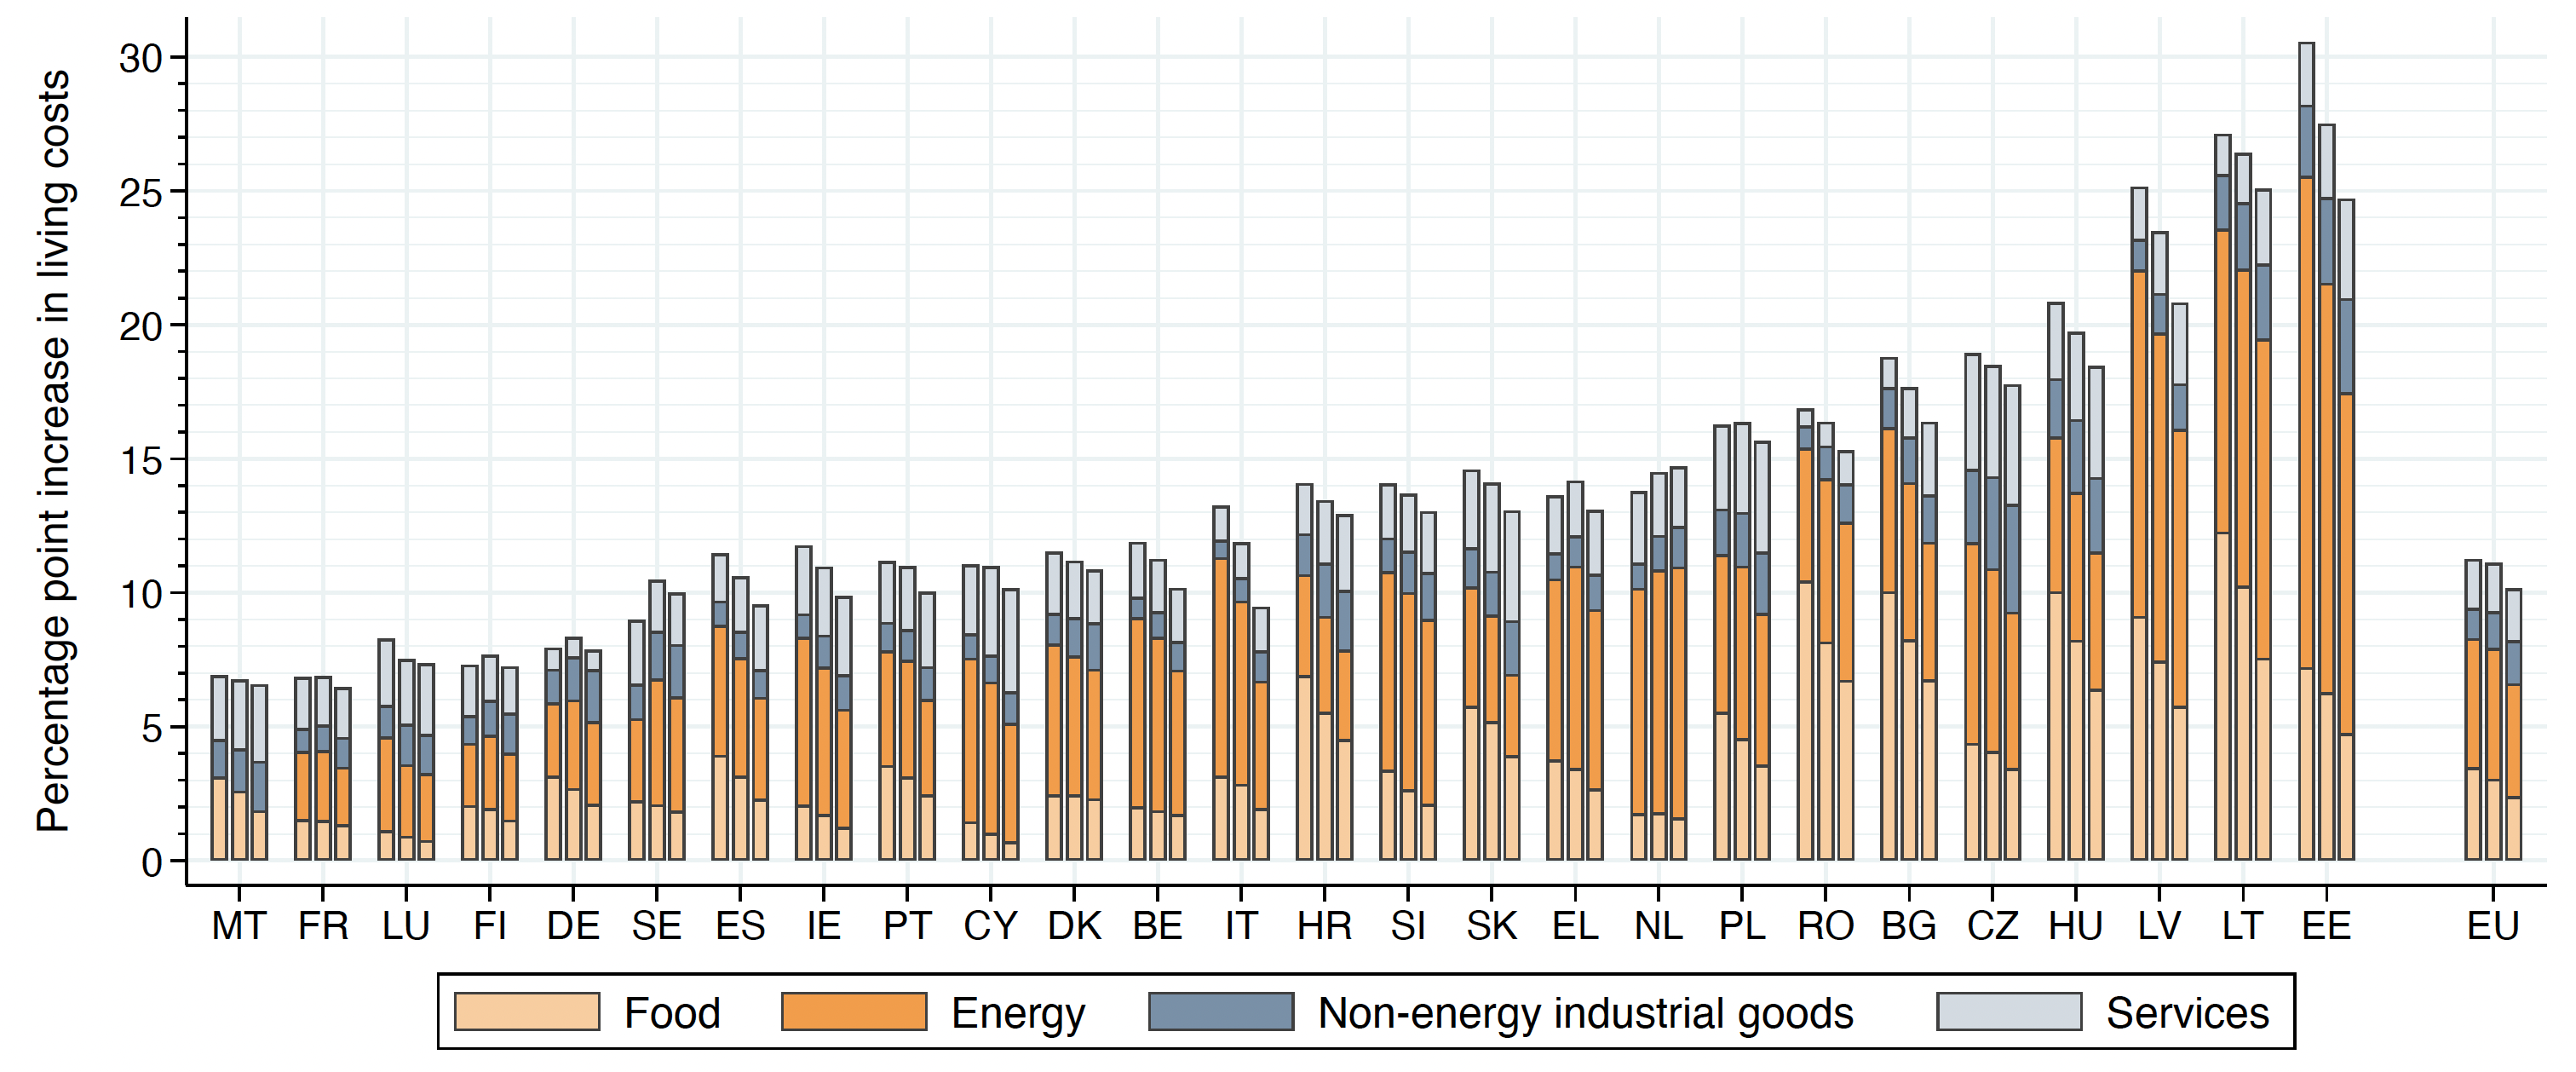
Consequently, different types of households tend to experience changes to their cost of living in substantially different ways and degrees. Figure 1 shows the predicted change in households’ living costs by country and income quintile, as driven by various product categories. It reveals that rising energy prices, despite the relatively low share of energy spending, contribute the most to households’ increasing living costs across the EU. The figure also shows that, while the overall cost increase for middle-income households (middle bars) is very close to headline HICP inflation in most countries, households in the lowest income quintile (left bars) face 1.1 percentage points higher effective inflation on average than those in the highest income quintile (right bars). Inflation inequality is substantially higher (by up to 5 percentage points) in poorer Member States with higher inflation and larger differences in consumption patterns across low-income and high-income households – putting financially constrained households at a double disadvantage.
Figure 1 Breakdown of the change in households living costs by country, income quintile and product category
Notes: Own calculations based on annual HICP inflation data from the Eurostat and microdata from the 2015 wave of the EU-HBS. The bars represent the implied change in living costs of European households with average expenditure shares in each product category by country and (equivalised) income quintile, during the period between August 2021 and August 2022. The left / middle / right bars represent the 1st / 3rd / 5th income quintiles, respectively. The EU average is calculated on the basis of official HICP country weights for 2022 provided by Eurostat. The relevant figures for Austria are missing due to data limitations.
Increases in households’ living costs translate directly into commensurate losses in purchasing power and real disposable income. Quantifying the effects of inflation on key indicators of poverty and social exclusion is nevertheless far from straightforward. Part of the reason lies with data lags and limitations surrounding European household surveys on income and consumption, but equally important is the fact that many leading EU social policy indicators are only indirectly affected by changes in the cost of living. For example, of the three components of the headline AROPE indicator measuring the share of population “at risk of poverty or social exclusion”, only the (non-monetary) component of severe material and social deprivation responds unequivocally to losses in households’ purchasing power.
The main contribution of my study is to quantify these linkages between inflation and various social policy indicators. The analysis focuses on partial effects of inflation and do not account for the potential impact of income support measures, demand substation, or behavioural change on the part of households. To capture the inflation effects on material and social deprivation (MSD), I use a regression-based analysis that identifies ongoing (within-household) changes over time from cross-sectional (between-household) differences at a single point in time, exploiting the strong statistical relationship between real disposable income and MSD incidence among national populations.
To predict the associated changes in absolute monetary poverty, I rely on the first set of cross-country comparable absolute poverty thresholds produced by a recent European Commission initiative (“Measuring and monitoring of absolute poverty - ABSPO”) for EU countries (Menyhért et al. 2021). Given that absolute (‘ABSPO') poverty lines reflect households’ basic needs and minimum living costs by design and construction, they can be easily adjusted to capture real or hypothetical changes in households’ financial position and poverty status due to inflation.
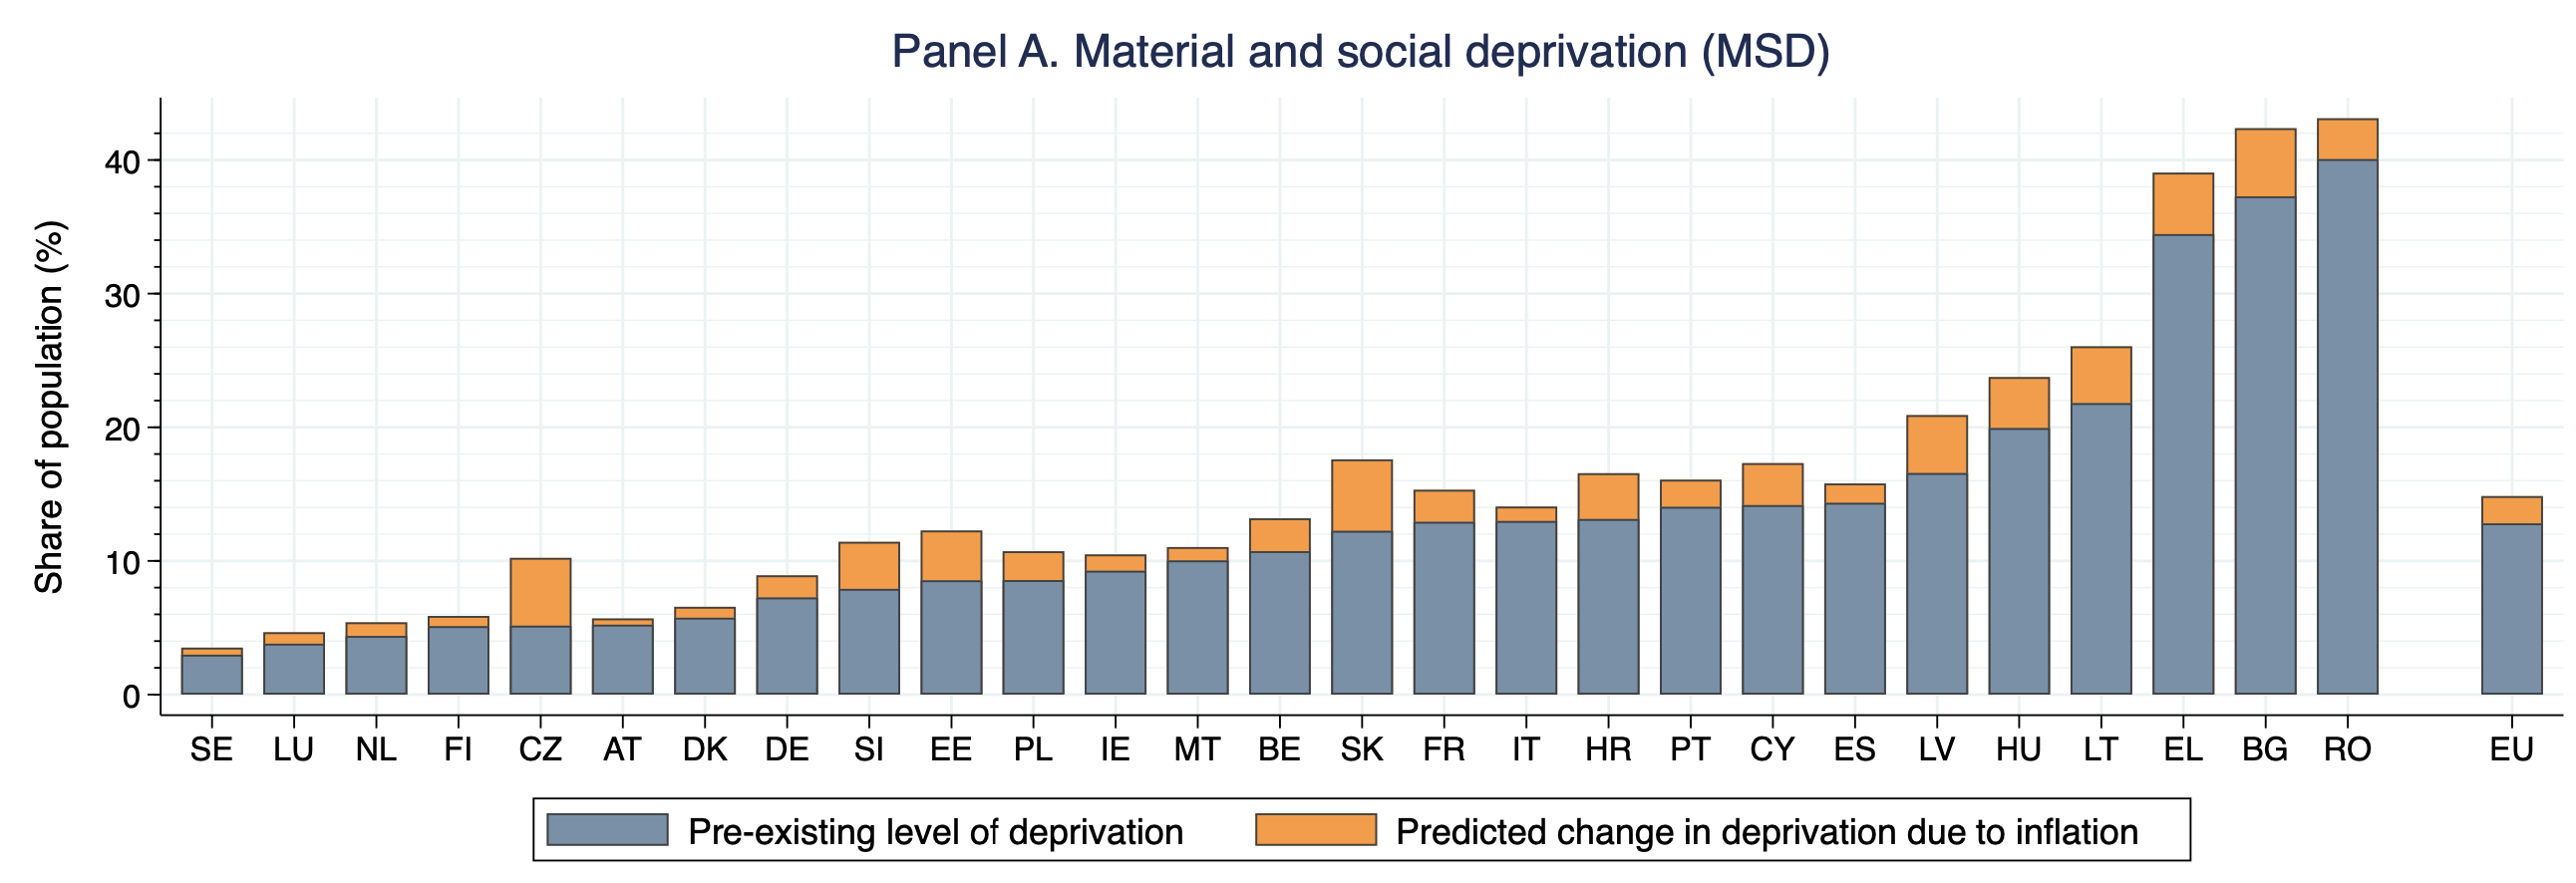
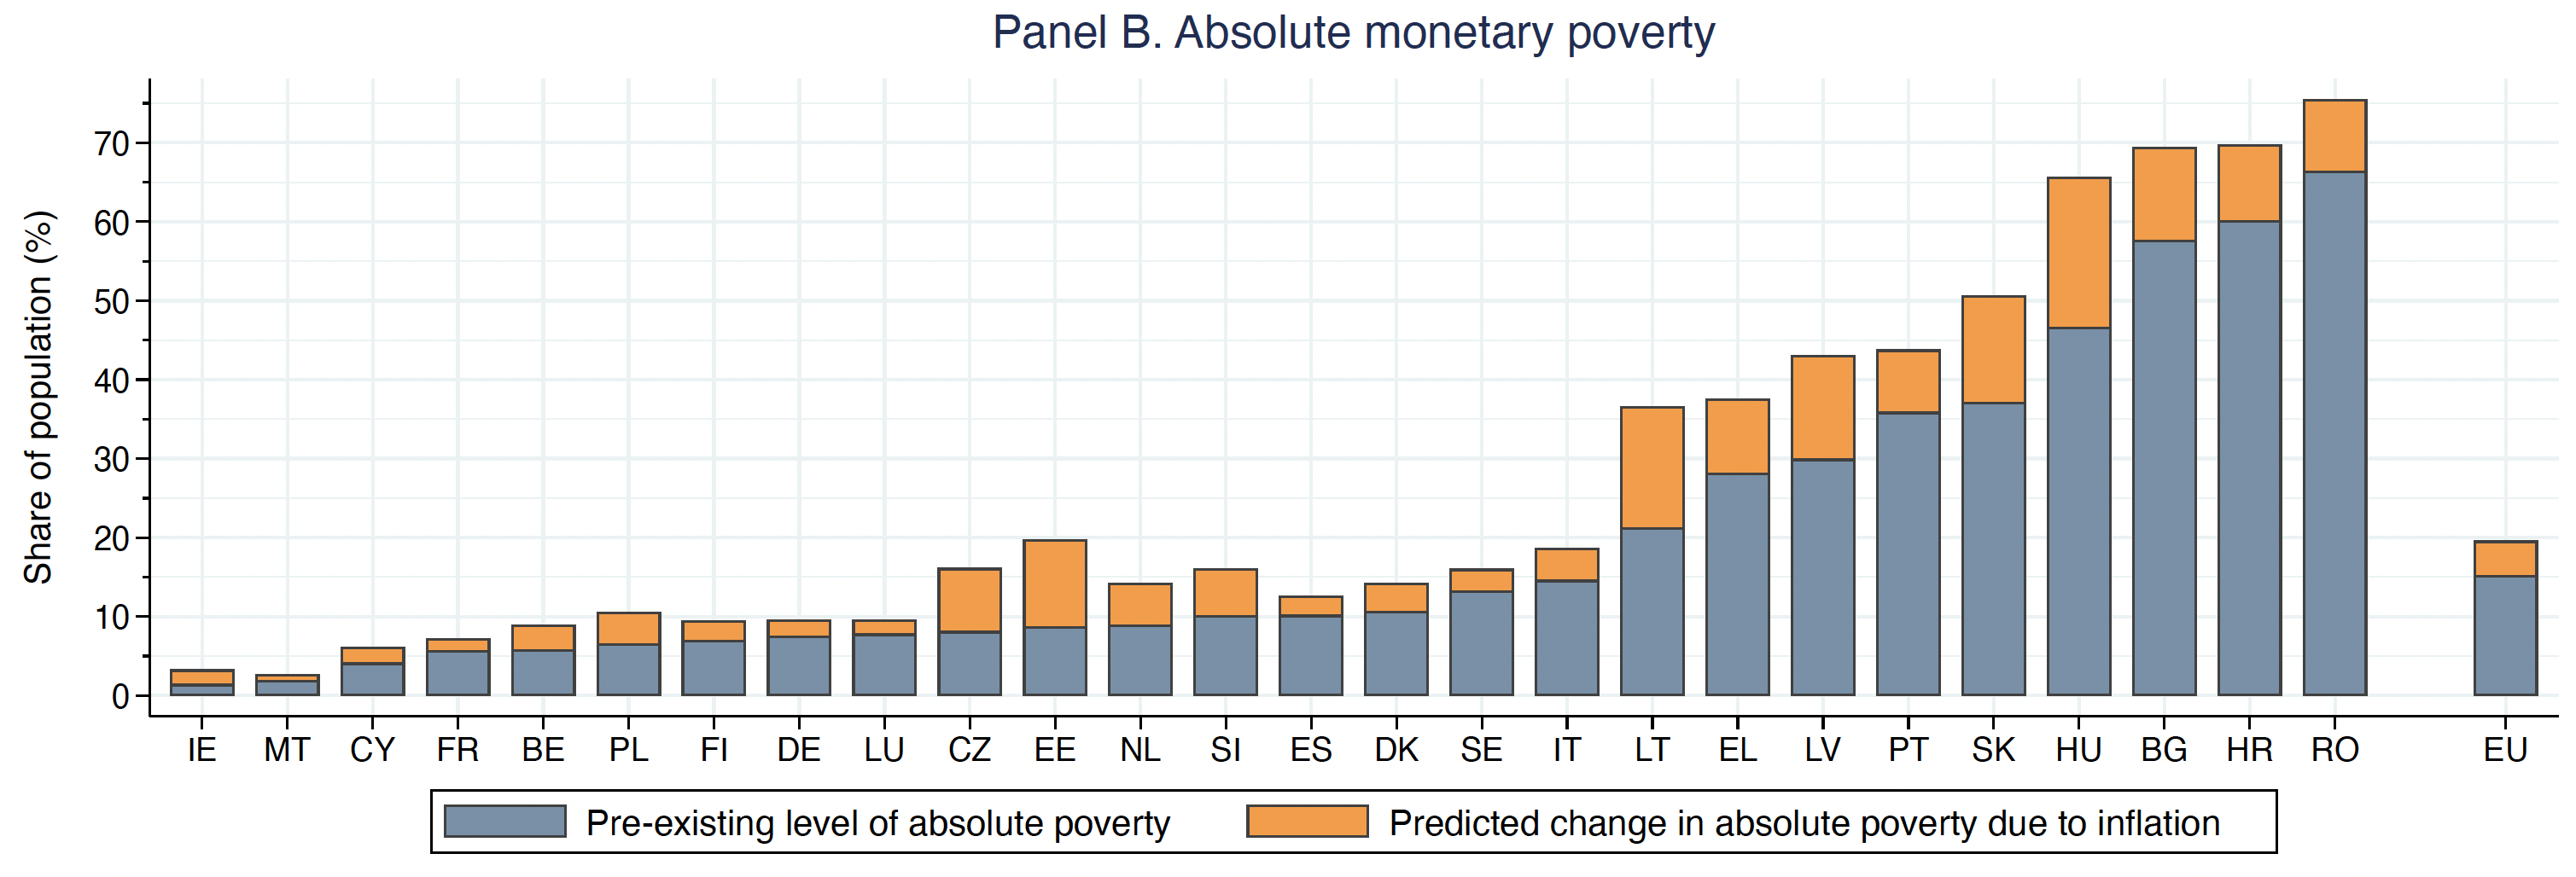
Figure 2 shows both the pre-existing level and the predicted change due to inflation in material and social deprivation and absolute poverty by country. Between August 2021 and August 2022, rising living costs have likely increased MSD by around 2 percentage points at the EU level and up to 6 percentage points in selected Member States. The corresponding effects on absolute poverty are considerably larger, and amount to 4.4 percentage points across the EU and up to 19 percentage points at the national level. The positive correlation between the pre-existing levels and predicted changes in both panels suggests that current inflation is widening existing social inequalities within the EU.
Figure 2 The predicted effects of inflation on material and social deprivation and absolute monetary poverty across the EU
Notes: Own calculations based on microdata from the cross-sectional EU-SILC and recent HICP inflation data from the Eurostat. Pre-existing levels refer to 2019, while the predicted change refers to the period between August 2021 and August 2022. Figures in Panel B present absolute poverty rates calculated using various methods and data sources as described by Menyhért et al. (2021). EU-level figures are calculated as the population-weighted average of the relevant country scores. The figures for Austria in Panel B are missing due to data limitations. For further methodological details, see Menyhért (2022).
My new work also quantifies the effect of rising energy and consumer prices on measures of energy poverty. The latter is commonly defined as a situation in which households are unable to access essential energy services, and is measured in a variety of ways.
One set of energy poverty indicators focuses on households’ self-reported inability to keep one’s own home adequately warm, or pay one’s utility bills without arrears, using data from the European Statistics on Income and Living Conditions (EU-SILC). Alternative indicators concentrate on the level or relative share of households’ energy expenditures using household budget survey data (EU-HBS). Quantifying the associated change in energy poverty due to inflation for these approaches requires different methods (i.e. regression-based methods versus simple arithmetic calculations) and limiting assumptions (i.e. no relative price effects versus no energy saving), and may produce rather divergent results.
Figure 3 shows the prediction results as possible boundary estimates of the true inflation effects on energy poverty between August 2021 and August 2022. Conservative estimates assuming only real income effects suggest that rising living costs have likely increased deprivation-based energy poverty by less than 1 percentage point at the EU level and less than 3 percentage points at the national level. Conversely, estimates that focus directly on energy expenditures and energy price inflation indicate that energy poverty may have increased by as many as 5 percentage points at the EU level and up to 19 percentage points in individual countries. Given the likely behavioural response on the part of households, the true effects are expected to be somewhere between the above bounds.
Figure 3 The predicted change in energy poverty indicators due to inflation across the EU
Notes: Own calculations based on microdata from the 2019 wave of the EU-SILC (Panel A) and the 2015 wave of the EU-HBS (Panel B). The pre-existing levels refer to these respective survey years, while the predicted change refers to the period between August 2021 and August 2022. In Panel B, the bars represent the pre-existing level and predicted change in expenditure-based energy poverty, based on applying a fixed 30% poverty threshold for households’ energy expenditure share. Austria is missing from Panel B due to data limitations. For more details, see Menyhért (2022).
Conclusions
In this study, I find that recent consumer price inflation has disproportionately affected households in poorer EU member states or with below-median income. As a result, material and social deprivation, absolute poverty and energy poverty may have increased by 1–5 percentage points at the EU level. The concentration of the adverse social effects of inflation among financially constrained and disadvantaged groups is deepening existing inequalities across the EU.
This situation calls for a strong and coordinated policy response. One potential area for intervention concerns short-term emergency measures aimed at offsetting some of the immediate consequences of price increases (such as reduced VAT rates, excise duties on energy or price caps). While price measures likely remain in place also in the medium term, it is equally important to strengthen the redistributive capacity of fiscal policy and ensure the effectiveness of social protection systems (Pereira da Silva et al. 2022). This primarily requires targeted income support measures and income policies that help channel public resources towards the most vulnerable and ensure that essential goods and services are readily available to all (Bethuyne et al. 2022). The broader and long-term policy objective is to align these protective measures with the strategic EU priorities of the twin transitions in line with the EU’s climate and social agenda. This requires a wide range of coordinated interventions, all of which could benefit from improved data collection, better social monitoring, and more comprehensive social policy analysis.
References
Bethuyne, G, A Cima, B Döhring, A Johannesson Lindén, R Kasdorp and J Varga (2022), “Targeted income support is the most social and climate-friendly measure for mitigating the impact of high energy prices”, VoxEU.org, 6 June .
Charalampakis, E, B Fagandini, L Henkel and C Osbat (2022), “The impact of the recent rise in inflation on low-income households”, ECB Economic Bulletin 7.
Claeys, G and L Guetta-Jeanrenaud (2022), “Who is suffering most from rising inflation?”, Bruegel blog post.
European Commission (2022a), Employment and Social Developments in Europe - Quarterly Review October 2022.
European Commission (2022b), Autumn 2022 Economic Forecast: The EU at a turning point.
European Commission (2022c), 2023 European Semester: Proposal for a Joint Employment Report.
Gürer, E and A Weichenrieder (2020), “Pro-rich inflation in Europe: Implications for the measurement of inequality”, German Economic Review 21(1):107-138.
Kaplan, G and S Schulhofer-Wohl (2017), “Inflation at the household level”, Journal of Monetary Economics 91:19-38.
Menyhért, B (2022), “The effect of rising energy and consumer prices on household finances, poverty and social exclusion in the EU”, Publications Office of the European Union, Luxembourg.
Menyhért, B, Zs Cseres-Gergely, V Kvedaras, B Mina, F Pericoli and S Zec (2021), “Measuring and monitoring absolute poverty (ABSPO) – Final Report”, Publications Office of the European Union, Luxembourg.
Pereira da Silva, L A, E Kharroubi, E Kohlscheen, M J Lombardi and B Mojon (2022), “Inequality hysteresis”, VoxEU.org, 24 September.
Uzeda, L, B Wong and Y Eo (2022), “Goods inflation is likely transitory, but upside risks to longer-term inflation remain”, VoxEU.org, 29 April.
Villani, D and G Vidal Lorda (2022), “Whom does inflation hurt most?”, European Commission.
