To what extent are individuals' incomes related to those of their parents? This question has seen renewed interest both in the general public and in academia as rising income inequality raises concerns about equality of opportunity. Intergenerational income persistence has now been studied in many countries, paving the way for insightful cross-country comparisons (Corak 2013). Yet, much remains to be known for France, a country characterised by relatively modest post-tax/transfers income inequality and largely inexpensive higher education tuition fees in international comparison. Indeed, while there are many studies estimating social class mobility in France, the academic literature on intergenerational income mobility is much more scarce (Lefranc and Trannoy 2005, Lefranc 2018).
In a recent paper (Kenedi and Sirugue 2023), we provide new estimates of intergenerational income mobility in France for almost 65,000 children born on mainland France between 1972 and 1981, using a combination of tax returns and census data. Measuring intergenerational income mobility in France remains a challenge because we cannot observe parents and children’s income in the same dataset at a sufficiently advanced age (see Sicsic 2023 for an analysis using the observed incomes of parents around the age of 50 and those of their children at the start of their careers). To overcome this difficulty, we define children's incomes as the average of total incomes observed within their household between the ages of 35 and 45, and predict their parents' wages at the same age based on a rich set of observable characteristics (education, detailed occupation, demographic and municipality of residence characteristics) using the two-sample, two-stage least squares (TSTSLS) methodology.
A key methodological contribution of our paper is to show, using the US Panel Study of Income Dynamics, that rank-based measures of intergenerational persistence are only modestly underestimated when using predicted parent incomes (TSTSLS) based on the same observable characteristics as we use for France, relative to what would be obtained if parent income were observed. These results highlight that in settings like ours, where parent income cannot be directly observed, rank-based measures of intergenerational persistence obtained with TSTSLS likely provide lower bounds that are reasonably close to the true estimates.
France is one of the least intergenerationally mobile advanced economies
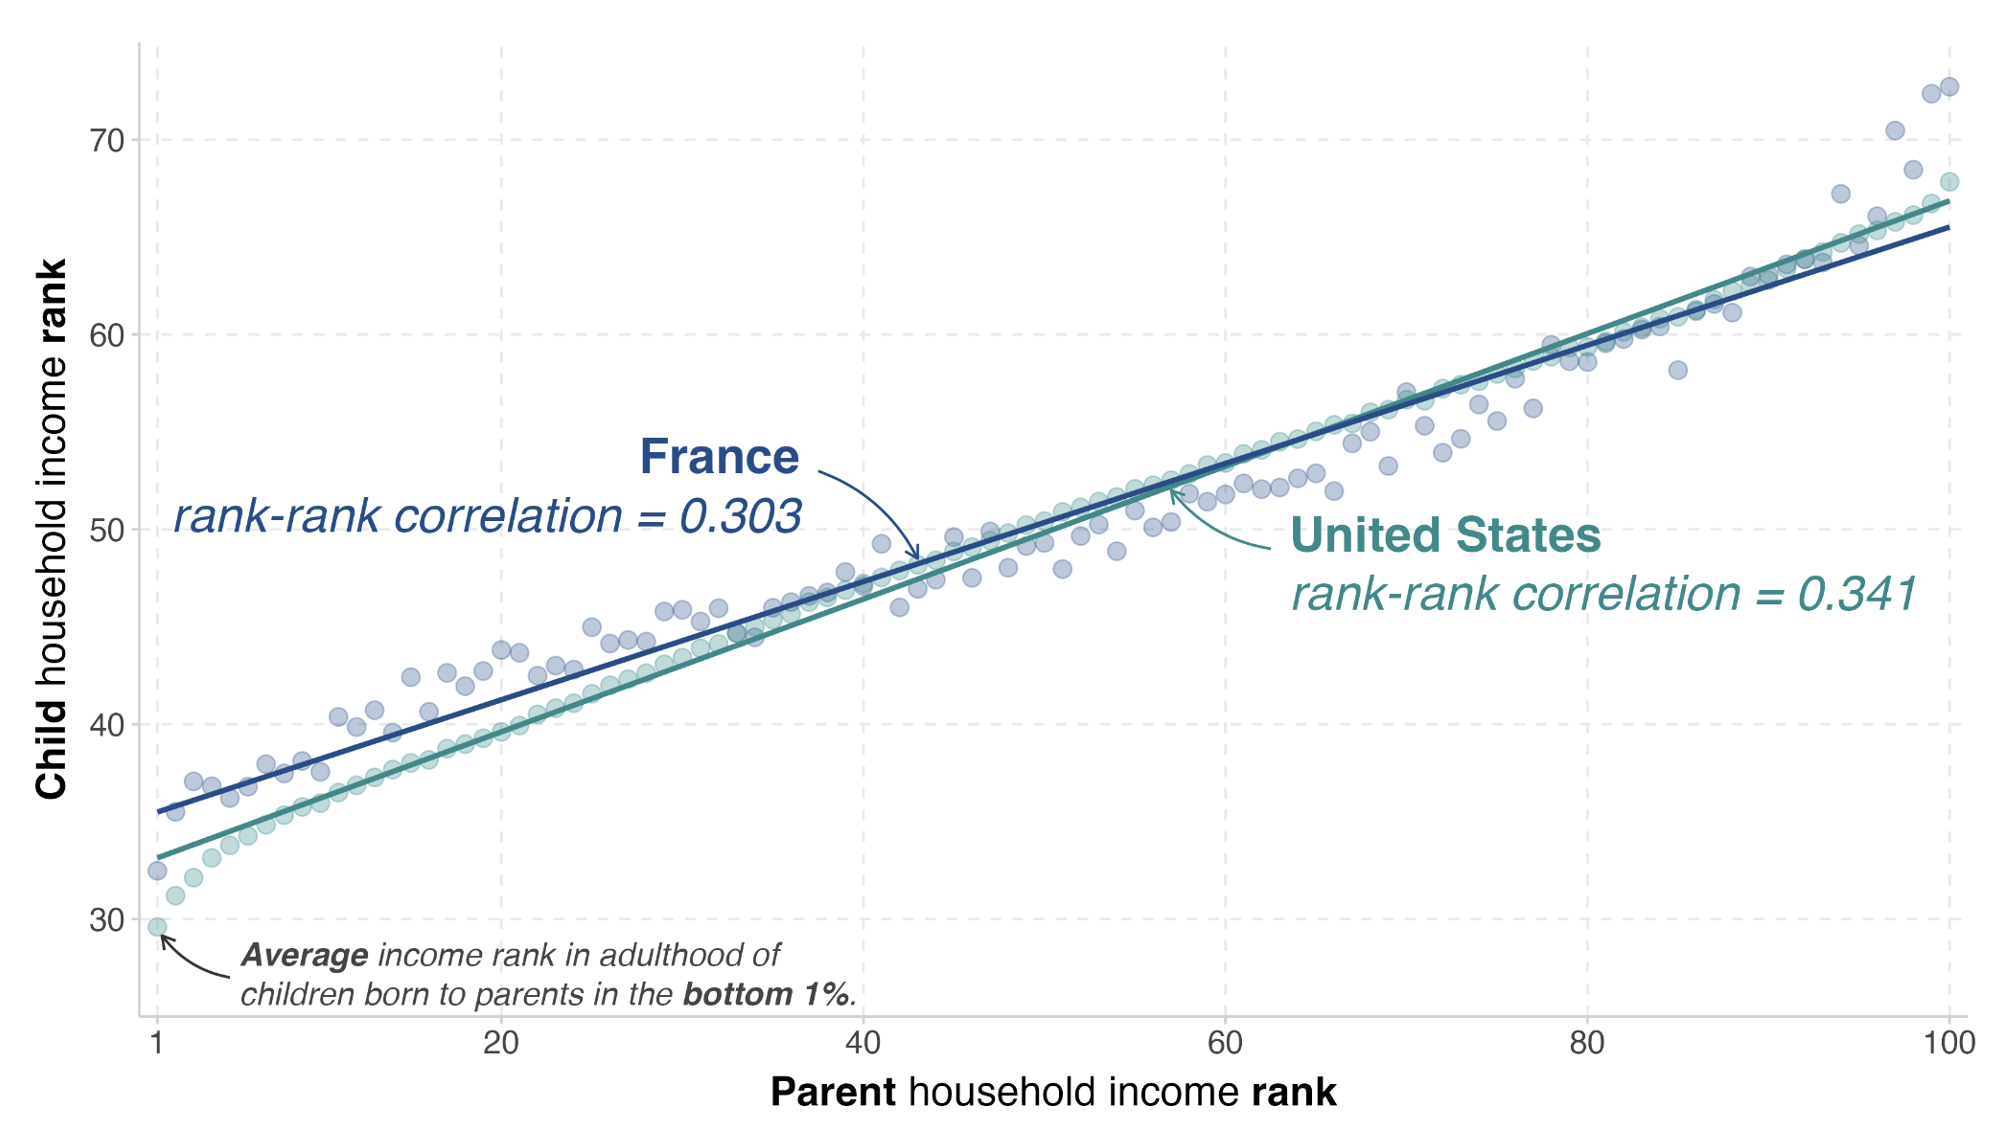
Figure 1 shows the rank-rank relationship in France, compared with that estimated in the US by Chetty et al. (2014) for children born in the early 1980s. The slope of this relationship, which also corresponds to the correlation, indicates the extent to which economic advantage is passed on from one generation to the next. According to our estimate, this correlation is 0.303 in France, meaning that a 10 percentile point increase in parents' income rank is associated, on average, with a 3.03 percentile increase in children's household income rank. This relationship is slightly steeper in the US, where the rank-rank correlation is 0.341.
Figure 1 Rank-rank relationships in France and the US
Notes: This graph shows the average household income rank reached by individuals in adulthood as a function of their parents' household income rank, in France (Kenedi and Sirugue, 2023) and the United States (Chetty et al., 2014). The slope of the regression lines across the scatterplots for each country represents the so-called 'rank-rank' correlation. In France, this correlation is 0.303, meaning that a 10 percentile increase in parents' household income is associated, on average, with a 3.03 percentile increase in children's household income.
Sample: For France, average household income observed between 35 and 45 for individuals born between 1972 and 1981, and predicted household income at the same age for parents. For the United States, average household income between 2011 and 2012 for individuals born in 1980 to 1982, and average household income between 1996 and 2000 for parents.
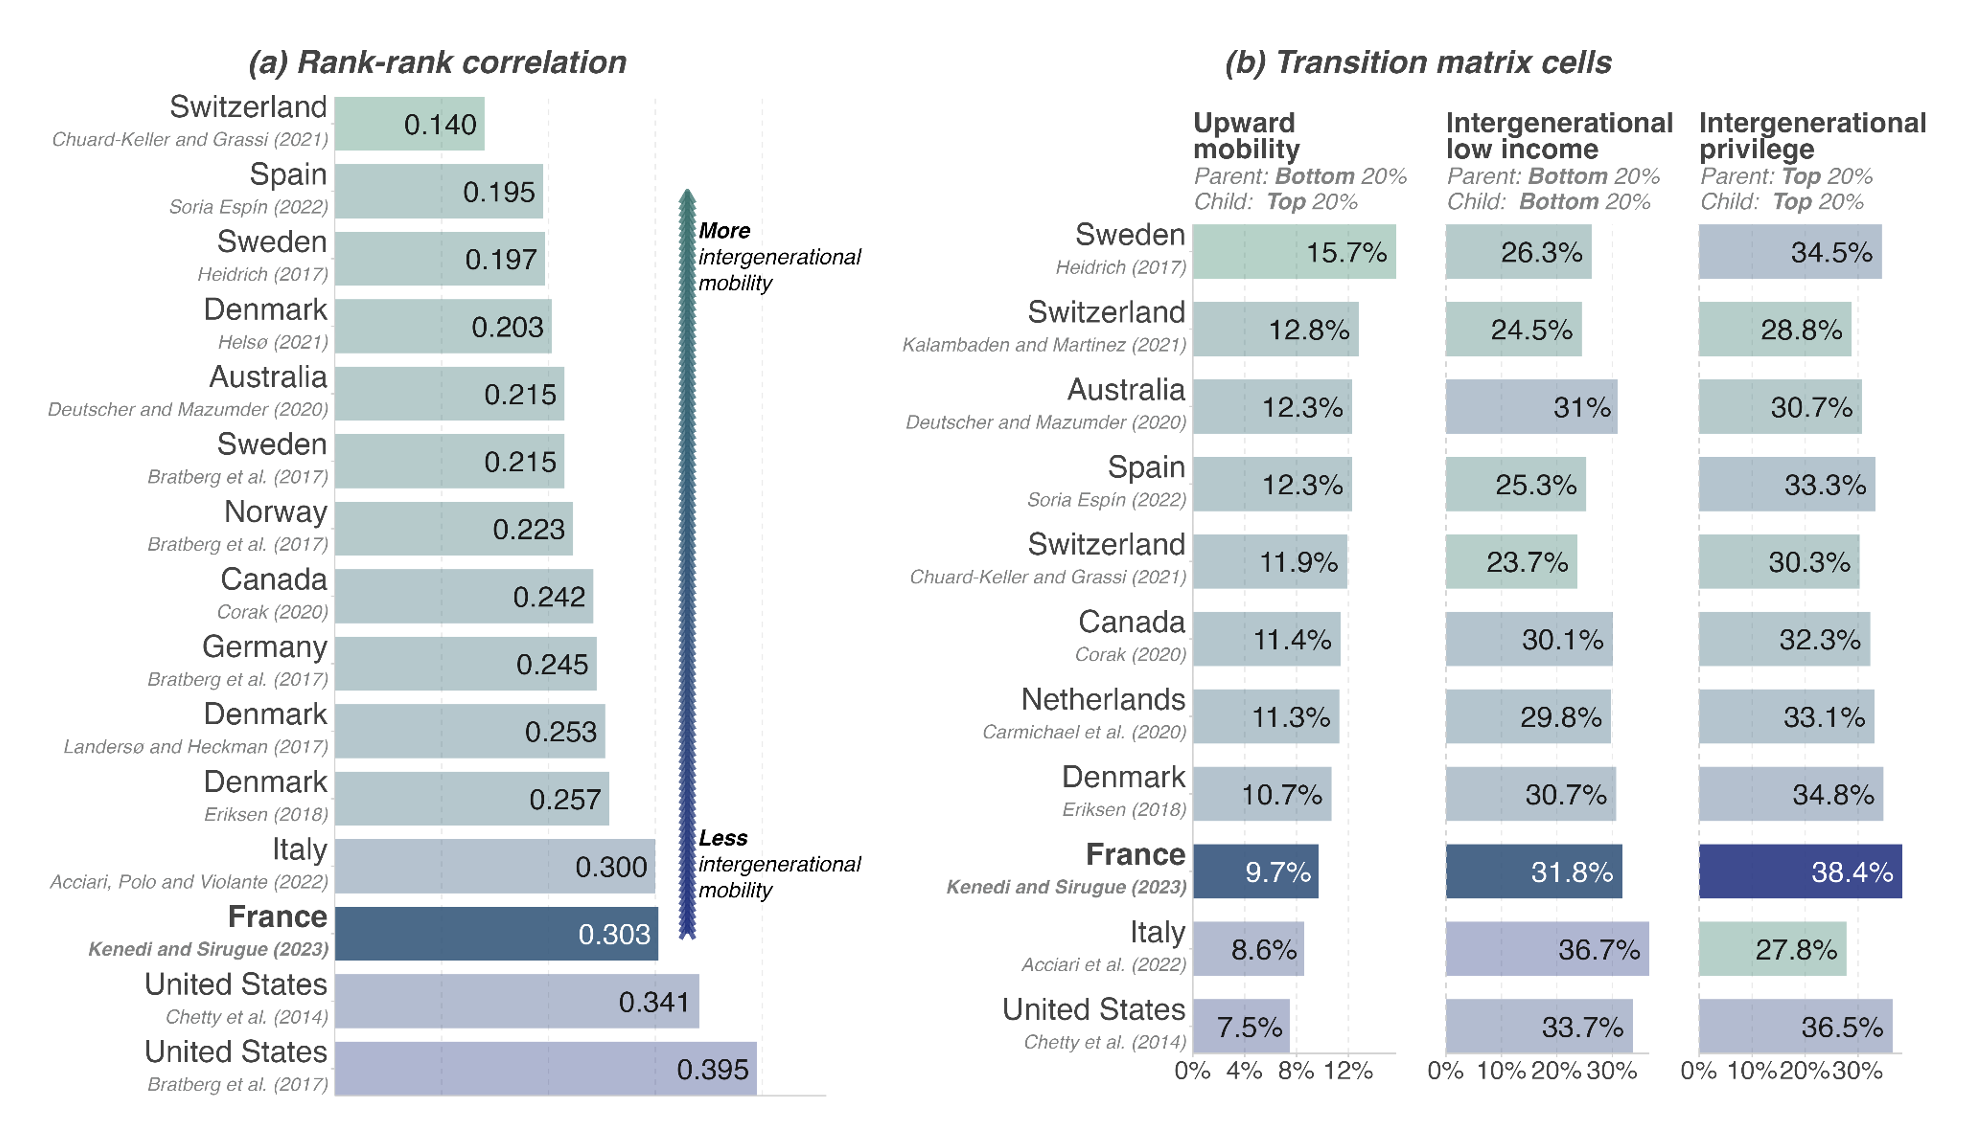
In Figure 2a, we compare the rank-rank correlations of the countries for which this measure has been estimated. This international comparison suggests that France stands out for its strong intergenerational income persistence. Its estimate is of similar magnitude as that for Italy and slightly lower than for the US, but higher than in other European countries such as Spain and the Scandinavian countries, as well as Australia and Canada. It is important to emphasise that this comparison is only indicative, as differences in methodology and income definitions across countries prevent estimates from being perfectly comparable to one another.
While the rank-rank relationship captures persistence on average, it does not allow us to analyse in detail who in the income distribution climbs the social ladder, and who falls. The transition matrix between quintiles of the income distribution is particularly useful for this exercise. Figure 2b shows, for France and other countries, three cells of this transition matrix (following some of the terminology in Corak 2020): upward mobility (probability of reaching the top 20% conditional on being born in the bottom 20%), intergenerational low income (probability of staying in the bottom 20%), and intergenerational privilege (probability of staying in the top 20%). This analysis confirms that, by international standards, France is one of the countries with the lowest levels of intergenerational mobility. Indeed, only 9.7% of children from families in the bottom 20% of the income distribution reach the top 20% of the income distribution in adulthood, a proportion four times lower than for children from families in the top 20% (38.4%). In comparison, these statistics are, respectively, 7.5% and 36.5% in the US, but 12.3% and 28.8% in Australia.
Figure 2 The rank-rank correlation and transition matrix in international comparison
Notes: Panel (a) shows the estimated rank-rank correlations across countries, while panel (b) shows different transition matrix cells. In France, the rank-rank correlation is 0.303, meaning that 10 percentile increase in parents' income is associated, on average, with a 3.03 percentile increase in children’s income. Moreover, 31.8% of children from families in the bottom 20% of the income distribution remain in the bottom 20% of households as adults. Only 9.7% of them reach the top 20% of the income distribution. Due to differences in the sample and income definitions across studies, this comparison is only indicative.
Sample: The studies used for each country are shown in grey below the country name.
Access to higher education is as unequal as in the US
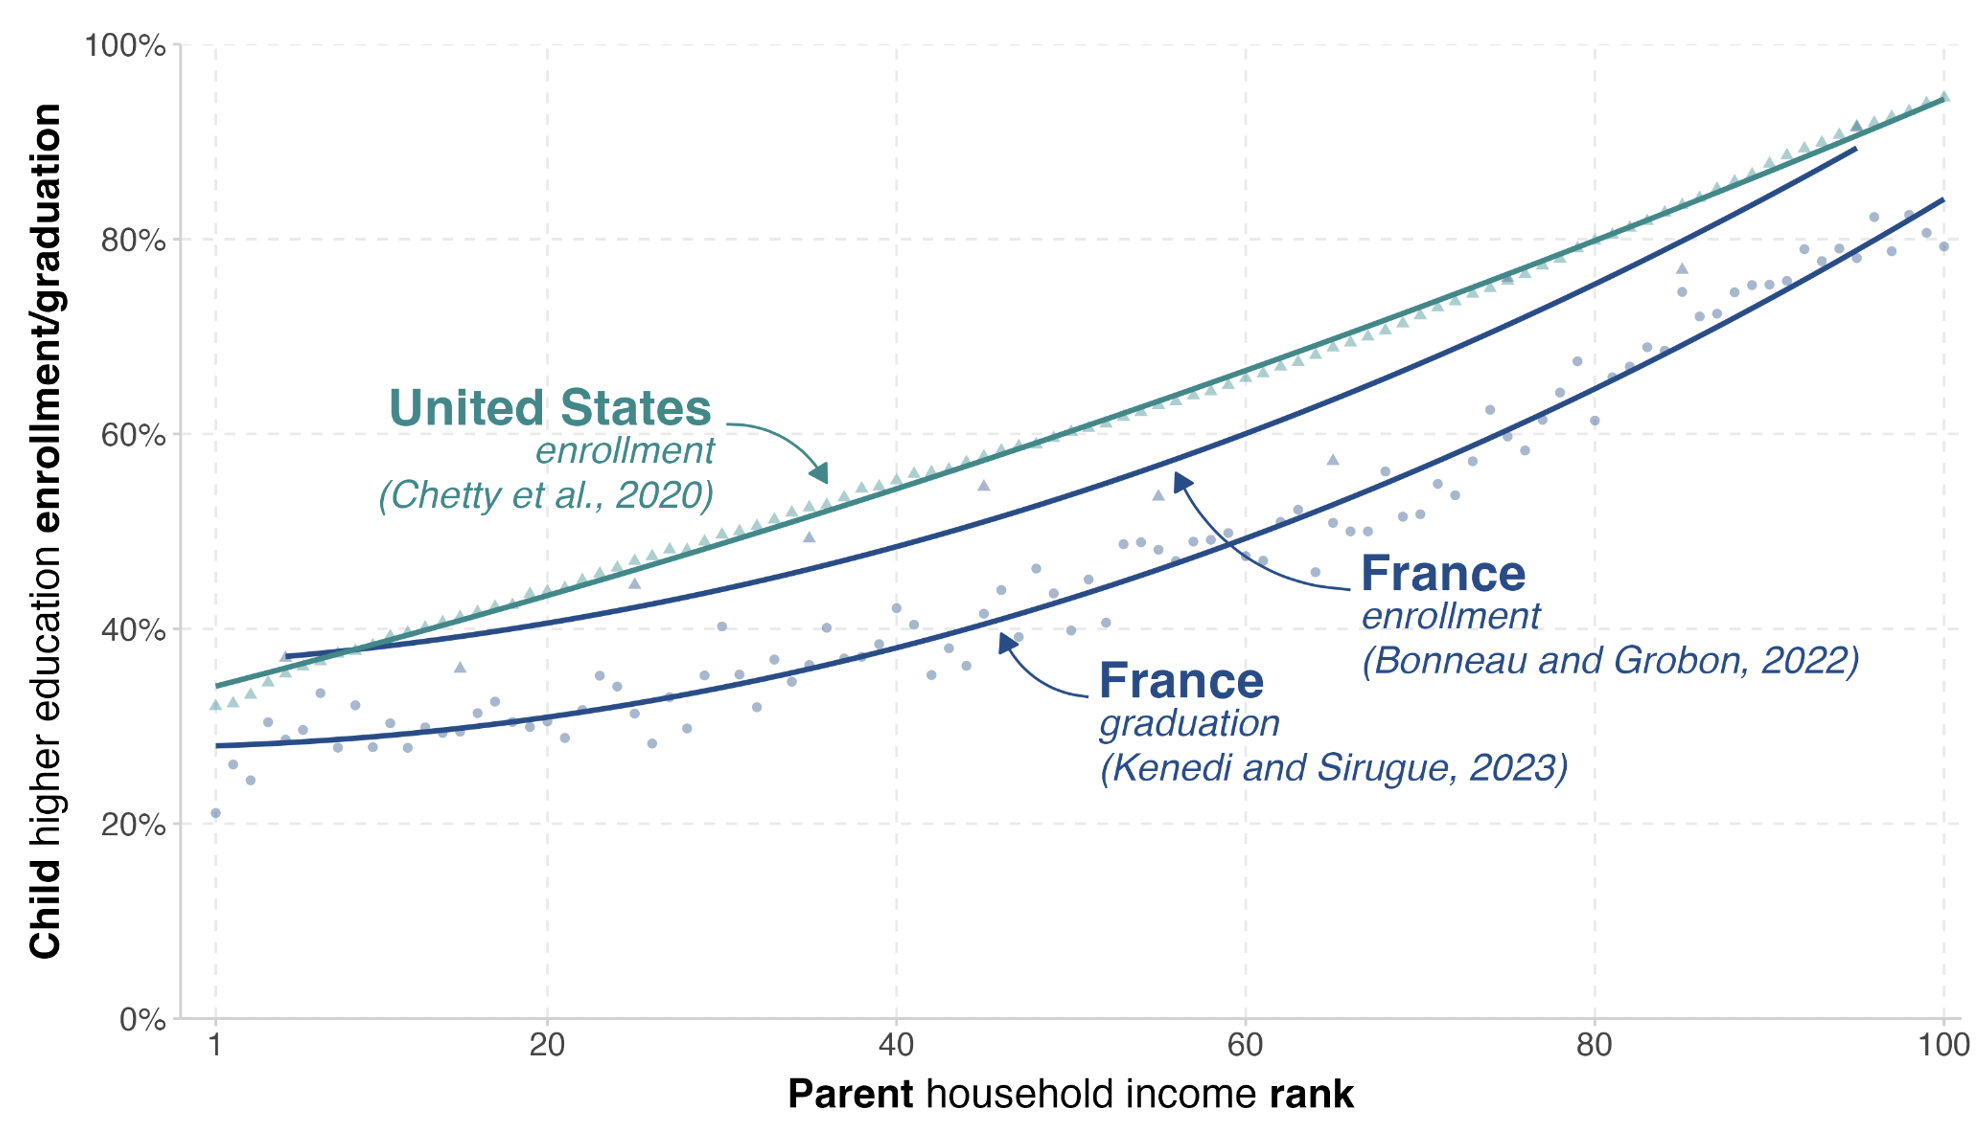
What factors might explain France’s low intergenerational mobility? Given the high wage returns associated with holding a higher education degree (Dabbaghian and Péron 2021), it is worth analysing whether these low levels of intergenerational mobility could be linked to inequalities in access to higher education by parent income. Figure 3 tends to confirm this hypothesis. This graph compares higher education enrollment rates in France and in the US by parent income rank. These estimates are based on the work of Chetty et al. (2020) for the US and Bonneau and Grobon (2022) for France. We also add estimates of graduation rates by parent income rank for France, computed using the annual census surveys since 2004 (to the best of our knowledge, there are no comparable statistics for the US). The similarities in the unequal access to higher education in France and the US, despite vast differences in the higher education landscape in both countries, suggests financial constraints are probably not the main explanation for these inequalities. Rather, differences in college readiness across the parent income distribution are probably the dominant factor at play. The strong relationship between parent income and child’s education has also been found in Switzerland (Chuard and Grassi 2020) as well as in Denmark (Landersø and Heckman 2016).
Figure 3 Access to higher education and graduation along the parent income distribution: France and the US
Notes: In France, just under 35% of individuals from families in the bottom 1% of the income distribution enrol in higher education, and around 30% graduate from higher education, whereas these proportions are 90% and 80% respectively for individuals from families in the top 1%. In the United States, the proportion of individuals from families in the bottom 1% of the income distribution who enrol in higher education is 32%.
Sample: For the US, enrolment in higher education is estimated by Chetty et al. (2020) using tax data from the Internal Revenue Service and data from the Department of Education for cohorts born between 1980 and 1991. For France, enrolment in higher education is estimated by Bonneau and Grobon (2022) using data from the Enquête nationale sur les ressources des jeunes (Dares/Insee), and graduation from higher education result from our own calculations using data from the Permanent Demographic Sample, for individuals born between 1972 and 1981 (their degree, reported in the annual census surveys, is observed for 86% of the individuals in the sample).
Variations within France are as large as across countries
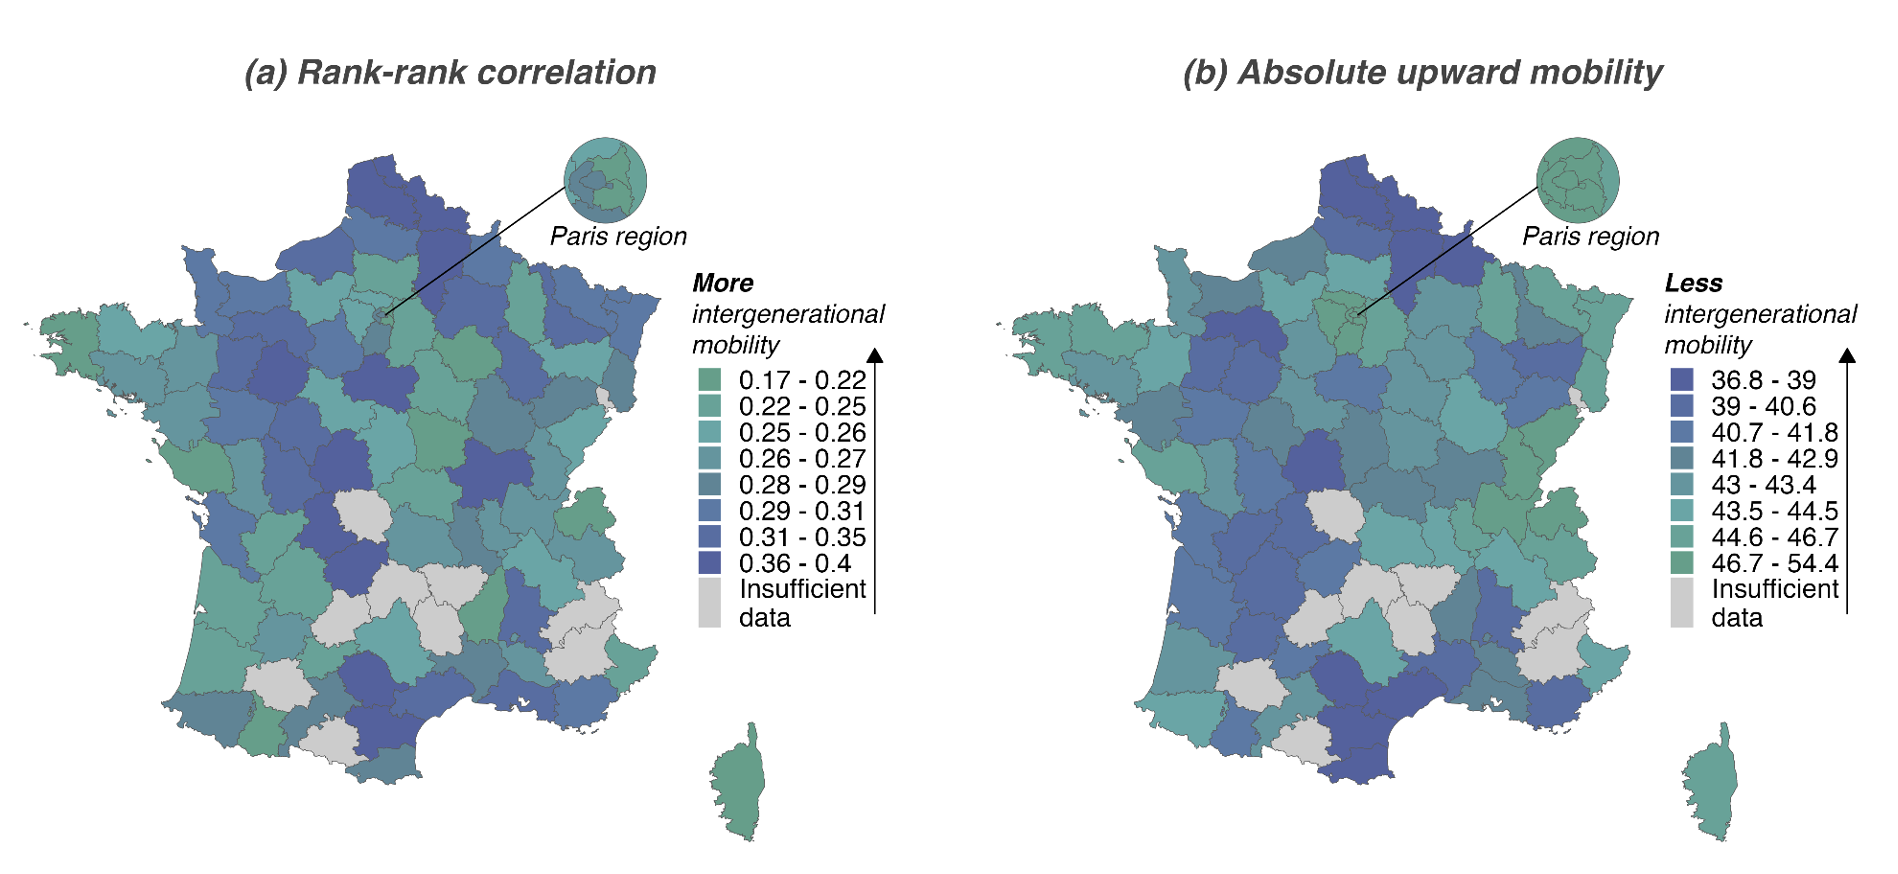
To further investigate the potential determinants of intergenerational persistence, we document its spatial variations. We assign individuals to the department they grew up in and compute two measures of intergenerational mobility: the rank-rank correlation, whose variations are shown in Figure 4a, and the expected income rank for individuals born to parents at the 25th percentile, labelled absolute upward mobility, shown in Figure 4b.
Figure 4 Spatial variations in intergenerational mobility
Notes: These maps show the departmental variations in intergenerational income persistence as measured by the rank-rank correlation (panel a) and the absolute upward mobility (panel b). To estimate this measure at the local level, each individual is assigned to the department in which they grew up. Income ranks are computed from national income distributions. The measure is not estimated for departments for which we have fewer than 200 observations.
Sample: Children born in mainland France between 1972 and 1981. Computations performed on the Permanent Demographic Sample (Insee, DGFiP) by Kenedi and Sirugue (2023).
Variations in intergenerational persistence across deparments are quite large, as much as what is observed across countries. This phenomenon has also been shown in other countries, notably in Italy (Acciari et al. 2019) and the US (Chetty et al. 2014). Intergenerational mobility is particularly low in the north of France and along the Mediterranean coast, but quite high in the west and in departments neighbouring Switzerland. We correlate the department-level estimates of intergenerational persistence with 14 variables related to social capital, inequality, education, and economic and demographic characteristics. The unemployment rate stands out by its consistently strong and negative correlation with intergenerational mobility measures.
Geographic mobility is associated with upward mobility
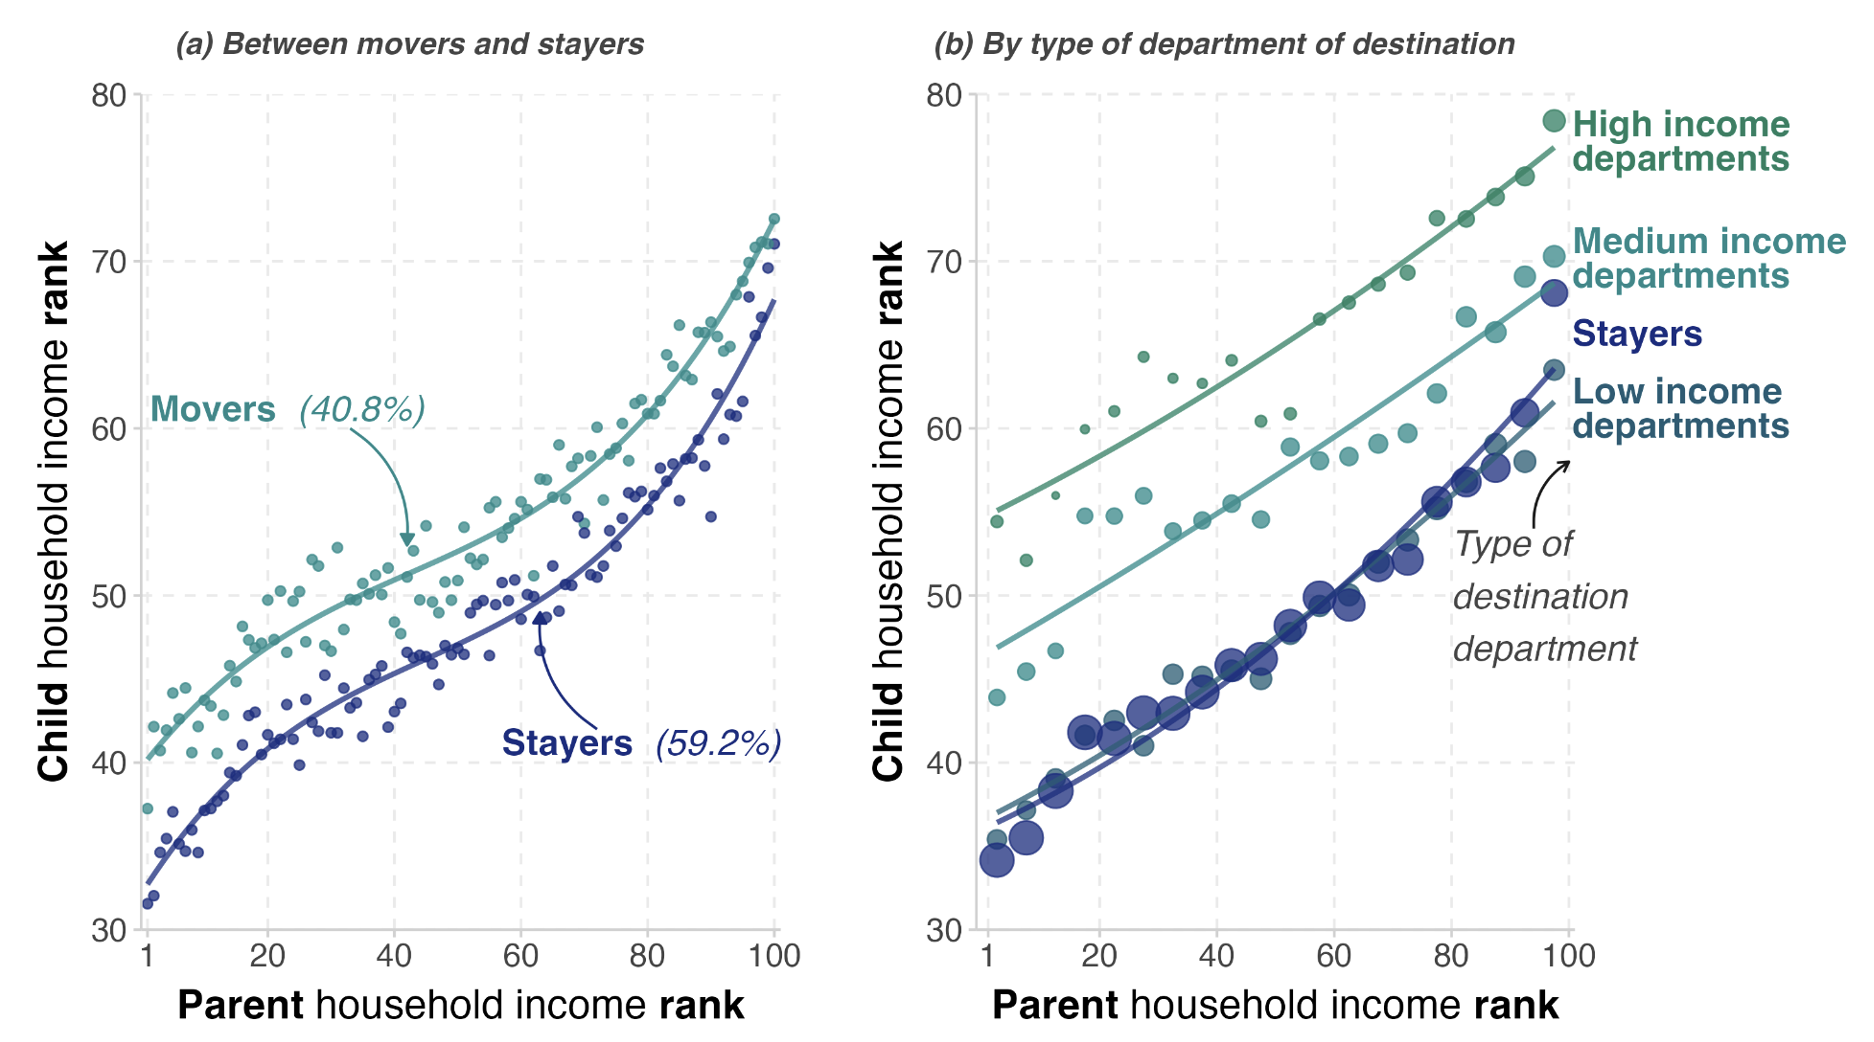
Given that some departments offer much more favourable mobility prospects than others, could geographic mobility actually be a tool for intergenerational mobility? We investigate this hypothesis in Figure 5a by comparing the relationship between individuals’ income rank and that of their parents separately for individuals who live in a different department than the one they grew up in (movers), and those who still live there as adults (stayers). Throughout the parent income distribution, geographically mobile individuals reach higher income ranks on average, but the gap narrows slightly for those from high-income families.
Figure 5 Geographic mobility and intergenerational mobility
Notes: This graph shows the average household income rank reached by individuals in adulthood as a function of their parents' household percentile income rank (panel a) and ventile income rank (panel b), by type of geographic mobility. Panel (a) distinguishes individuals who live in a different department than the one they grew up in (movers), and those who still live there as adults (stayers). Panel (b) further distinguishes movers by type destination department: low income departments, medium income departments, and high income departments.
Sample: Children born in mainland France between 1972 and 1981. Computations performed on the Permanent Demographic Sample (Insee, DGFiP) by Kenedi and Sirugue (2023).
To assess whether this gap is only due to movers migrating to higher income departments, we reproduce Figure 5a using ranks computed at the local level instead of the national level. If we were to observe no gap with local ranks, this would suggest that mobility towards higher income departments is the only reason why geographically mobile individuals have better intergenerational mobility prospects. Instead, we observe that the gap shrinks, implying that this mechanism is only part of the story. Indeed, the fact that there is still a gap in local ranks suggests that movers are also more successful in breaking away from the socio-economic position held by their parents within their origin department, irrespective of local socio-economic conditions.
To deepen the analysis, Figure 4b shows the average income rank reached by individuals according to their destination department. The upward mobility of those who have moved to a low-income department is equivalent to that of stayers. It is much higher for individuals who moved to a high-income department, regardless of their parents' income level. Individuals from families with the lowest incomes who move to high-income departments achieve on average the same level of income as children from high-income families who do not move. Even though not causal, these findings illustrate the important role that geographic mobility seems to play in shaping intergenerational mobility.
Conclusion: A call for more systematic international comparisons
Our study shows that in France there are strong differences in economic trajectories between children from families at the bottom and at the top of the income distribution. This intergenerational persistence is slightly lower than in the US, and close to that observed in Italy. However, it is higher than in many OECD countries, such as Scandinavian countries and Australia.
These international comparisons remain imperfect due to the lack of harmonisation of the samples and variable definitions used from one country to another. Following the example of the initiatives led by the World Inequality Lab or the Global Repository of Income Dynamics, an international coordination effort would be desirable in order to obtain harmonised estimates of intergenerational mobility in each country. We hope that intergenerational mobility researchers across the globe can get together in order to produce the most comparable estimates of intergenerational mobility across countries and over time.
References
Acciari, P, A Polo, and G L. Violante (2019), ““And Yet, It Moves”: Intergenerational Mobility in Italy,” VoxEU.org, 13 July.
Acciari, P, A Polo, and G L Violante (2022), ““And Yet, It Moves”: Intergenerational Mobility in Italy,” American Economic Journal: Applied Economics 14(3): 118–163.
Bonneau, C and S Grobon (2022), Unequal Access to Higher Education Based on Parental Income: Evidence from France, Technical Report 2022/01, World Inequality Lab.
Bratberg, E, J Davis, B Mazumder, M Nybom, D D. Schnitzlein, and K Vaage (2017), “A Comparison of Intergenerational Mobility Curves in Germany, Norway, Sweden, and the US,” The Scandinavian Journal of Economics 119(1): 72–101.
Carmichael, F, C K Darko, M G Ercolani, C Ozgen, and W S Siebert (2020), “Evidence on Intergenerational Income Transmission Using Complete Dutch Population Data,” Economics Letters 189: 108996.
Chetty, R, N Hendren, P Kline, and E Saez (2014), “Where Is the Land of Opportunity? The Geography of Intergenerational Mobility in the United States,” The Quarterly Journal of Economics 129(4): 1553–1623.
Chetty, R, N Hendren, P Kline, and E Saez (2014), "Where is the land of opportunity? Intergenerational mobility in the US", VoxEU.org, 4 February.
Chetty, R, J N Friedman, E Saez, N Turner, and D Yagan (2020), “Income Segregation and Intergenerational Mobility Across Colleges in the United States,” The Quarterly Journal of Economics 135(3): 1567–1633.
Chuard-Keller, P and V Grassi (2021), “Switzer-Land of Opportunity: Intergenerational Income Mobility in the Land of Vocational Education,” SSRN.
Chuard, P and V Grassi (2020), “Switzerland: High intergenerational income mobility, despite low educational mobility,” VoxEU.org, 12 October.
Corak, M (2013), “Income Inequality, Equality of Opportunity, and Intergenerational Mobility,” Journal of Economic Perspectives 27(3): 79–102.
Corak, M (2020), “The Canadian Geography of Intergenerational Income Mobility,” The Economic Journal 130(631): 2134–2174.
Dabbaghian, G, and M Péron (2021), "Tout diplôme mérite salaire? Une estimation des rendements privés de l’enseignement supérieur en France et de leur évolution", Rapport du Conseil d’Analyse Economique (CAE) 75.
Deutscher, N and B Mazumder (2020), “Intergenerational Mobility across Australia and the Stability of Regional Estimates,” Labour Economics 66: 101861.
Eriksen, J (2018), Finding the Land of Opportunity: Intergenerational Mobility in Denmark, Technical Report, Aalborg University.
Heidrich, S (2017), “Intergenerational Mobility in Sweden: A Regional Perspective,” Journal of Population Economics 30(4): 1241–1280.
Helsø, A-L (2021), “Intergenerational Income Mobility in Denmark and the United States,” The Scandinavian Journal of Economics 123(2): 508–531.
Kalambaden, P and I Z Martınez (2021), “Intergenerational Mobility Along Multiple Dimensions Evidence from Switzerland”.
Kenedi, G and L Sirugue (2023), "Intergenerational Income Mobility in France: A Comparative and Geographic Analysis", Journal of Public Economics 226.
Landersø, R and J J Heckman (2017), “The Scandinavian Fantasy: The Sources of Intergenerational Mobility in Denmark and the US,” The Scandinavian Journal of Economics 119(1): 178–230.
Landersø, R and J J Heckman (2016), “The Scandinavian Fantasy: The Sources of Intergenerational Mobility in Denmark and the US,” VoxEU.org, 12 September.
Lefranc, A (2018), “Intergenerational Earnings Persistence and Economic Inequality in the Long Run: Evidence from French Cohorts, 1931-75,” Economica 85(340): 808–845.
Lefranc, A and A Trannoy (2005), “Intergenerational Earnings Mobility in France: Is France More Mobile than the US?,” Annales d’Économie et de Statistique 78: 57–77.
Soria Espín, J (2022), “Intergenerational Mobility, Gender Differences and the Role of Out-Migration: New Evidence from Spain,” SSRN.
Sicsic, M (2023), "Qui est mieux classé que ses parents dans l’échelle des revenus ? Une analyse de la mobilité intergénérationnelle en France" Economie et Statistique 540(1): 3-20.

