The recent debt surge resulting from the COVID-19 fiscal stimuli, coupled with the end of historically low-interest rates, has added a sense of urgency to the discussion of fiscal sustainability. However, the empirical definition of sustainability remains elusive.
Modern debt sustainability analysis (DSA) tends to focus on liquidity indicators such as the ratio of debt service to fiscal revenues and the stock of international reserves, or on potentially explosive debt dynamics that can trigger financial stress, as captured by the failure to stabilise the debt-to-GDP ratio, eschewing an explicit measure of the country’s solvency (World Bank 2019, IMF 2021).
Moreover, whereas DSA in emerging countries often highlights the role of currency mismatches and focuses on the foreign currency share of public debt, the emphasis is placed on the currency composition of the sovereign’s explicit liabilities,
which may be misleading if not considered together with other liabilities (public sector wages, pension payments and transfers) or with the asset side of the government’s balance sheet. To mitigate these drawbacks, we propose a balance sheet approach to debt sustainability that uses the country’s net worth as the key indicator of solvency (Levy Yeyati and Sturzenegger 2023).
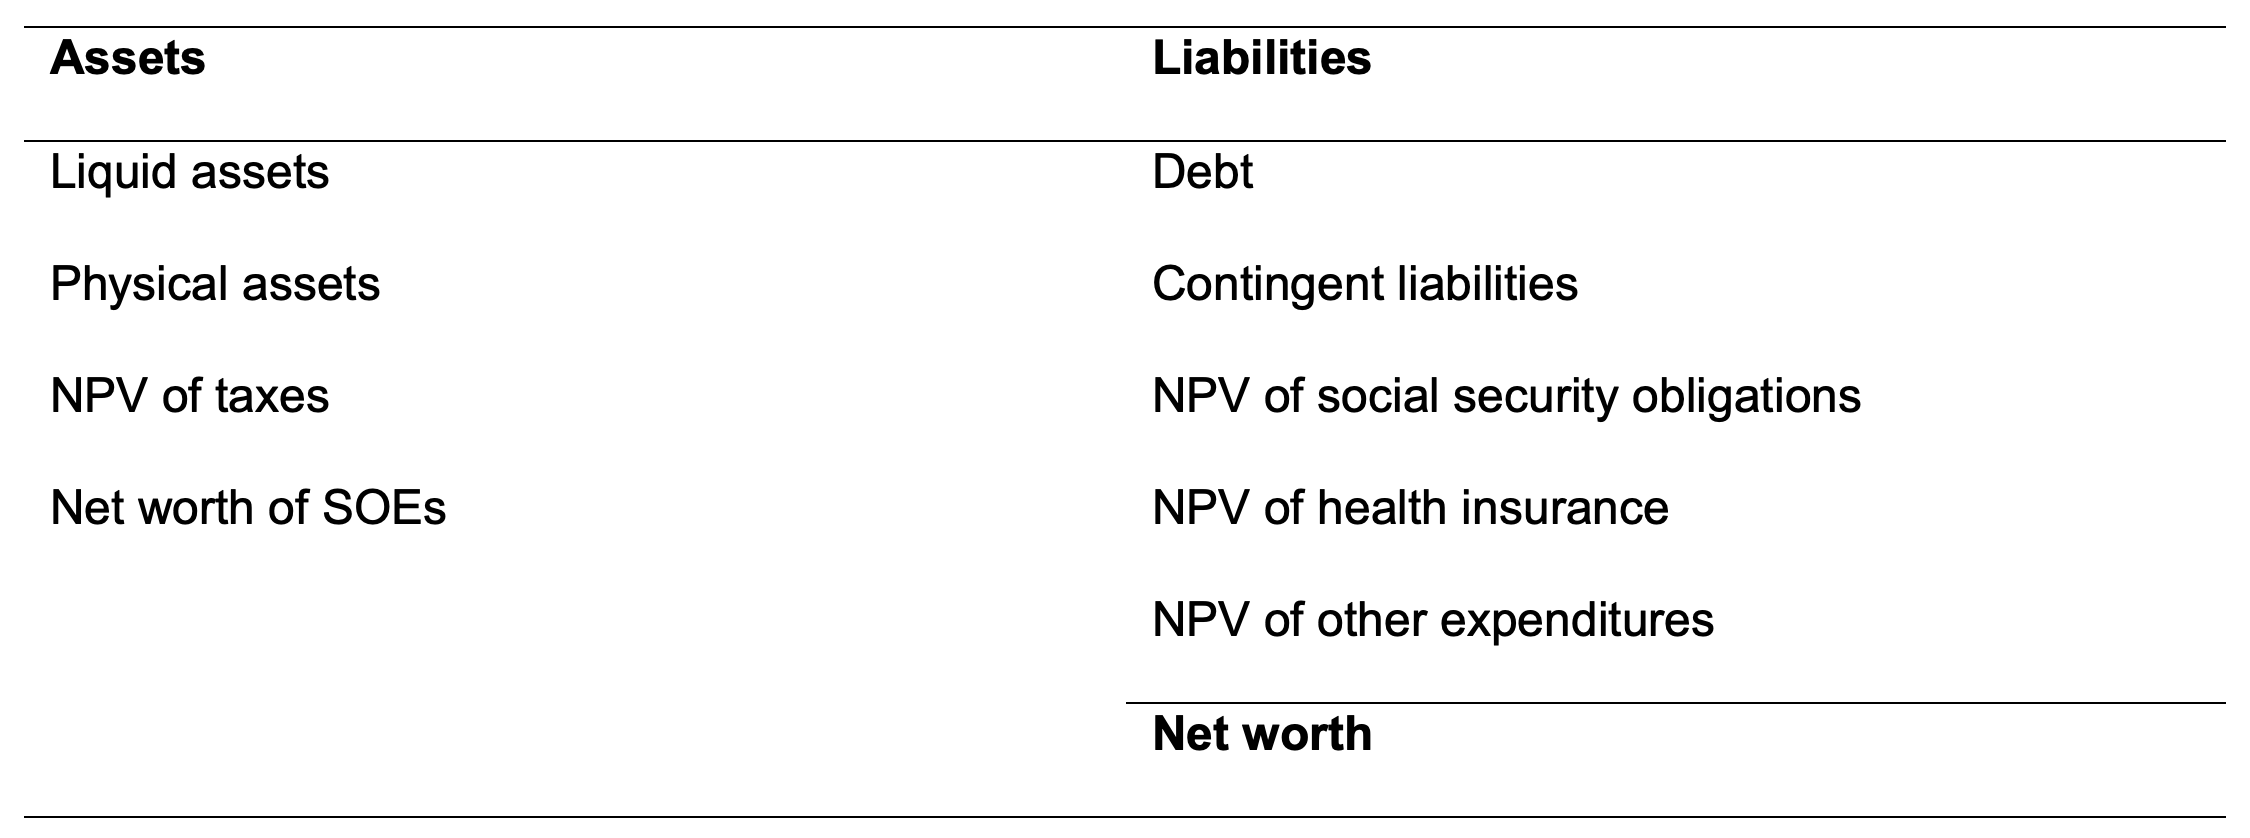
Table 1 The balance sheet
Note: NPV is the net present value.
The balance sheet approach methodology follows directly from Table 1. On the asset side, liquid assets are computed at their current market value, physical assets are taken at market value if they can be disposed of, and state-owned enterprises (SOEs) contribute with their approximate market value whenever there is one. The main component of the asset side is also the most difficult to evaluate: the net present value of taxes given a current tax policy. On the liability side (except for those with a predetermined cash flow, such as net social security outlays and debt payments, which are computed separately), the main item is the present value of fiscal obligations.
The methodology can be summarised as follows:
- Characterise the environment based on a set of driving variables (GDP, the real exchange rate, the international interest rate, and commodity prices, among others) and estimate a model to simulate their future evolution.
- Estimate the response functions of specific components of public income and expenditure to the drivers.
- Simulate paths for the drivers, and then for income and expenditure flows (by plugging the simulated paths into the revenue and spending functions calibrated in step 2), and finally the primary surplus.
- Add the predetermined cash flows (typically, social security liabilities and debt payments) to the simulated primary surplus to obtain the government’s cash flow, the net present value of which is the estimate of net worth. This exercise can be replicated many times for different shocks for the driver to obtain a distribution of the sovereign’s net worth.
Much as a probabilistic DSA looks at the distribution of debt indicators to evaluate the probability that a country is fiscally sustainable (e.g. if the indicator hits an arbitrary threshold), the balance sheet approach does so using the country’s net worth (a natural threshold, although not the only one, in this case, would be zero).
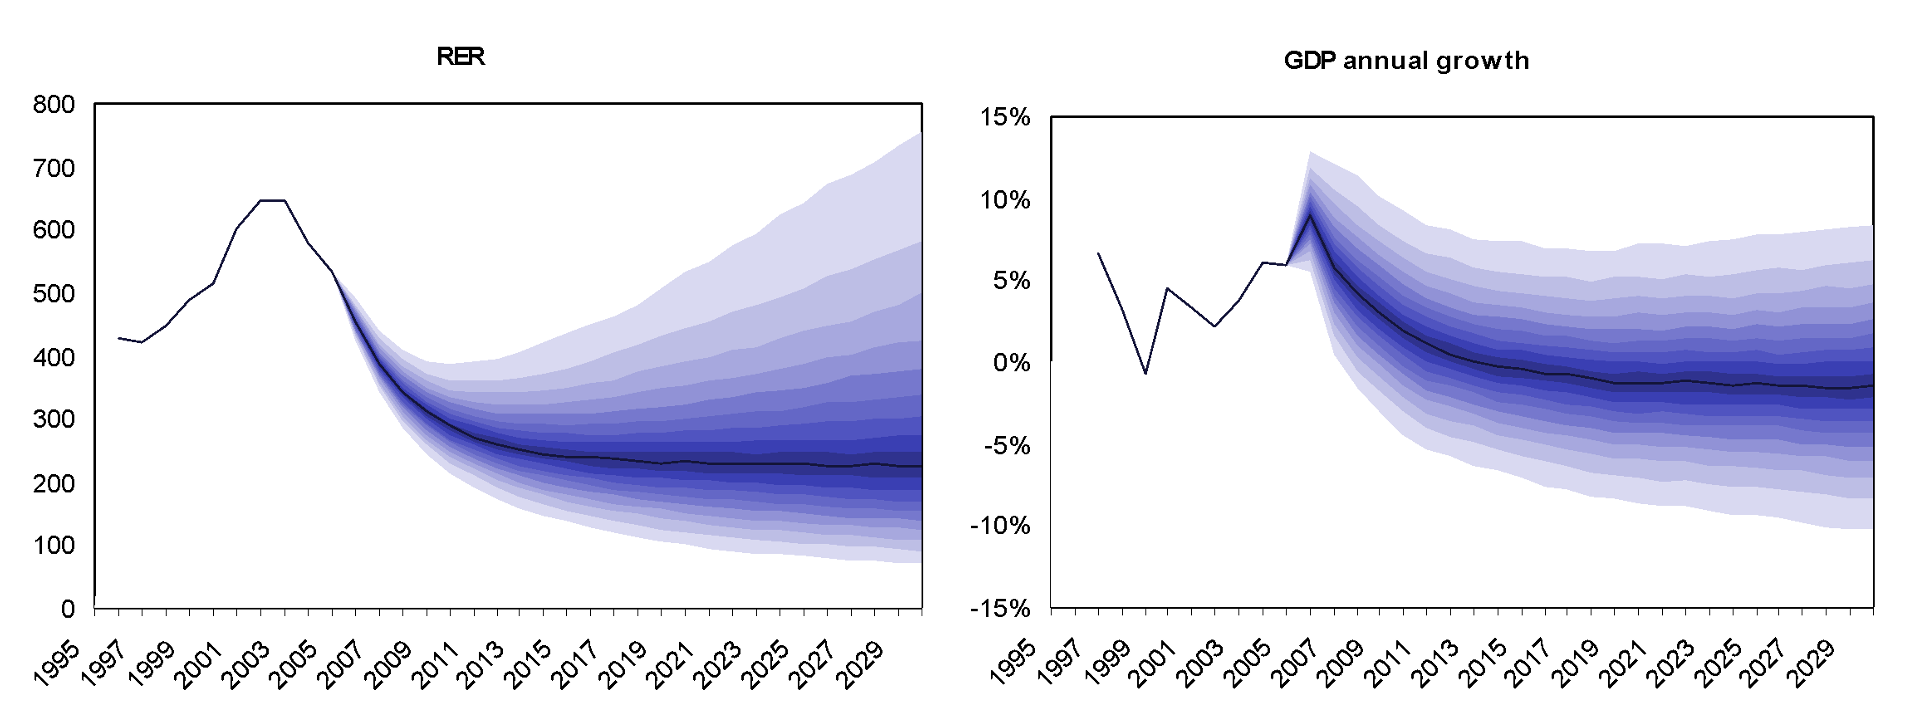
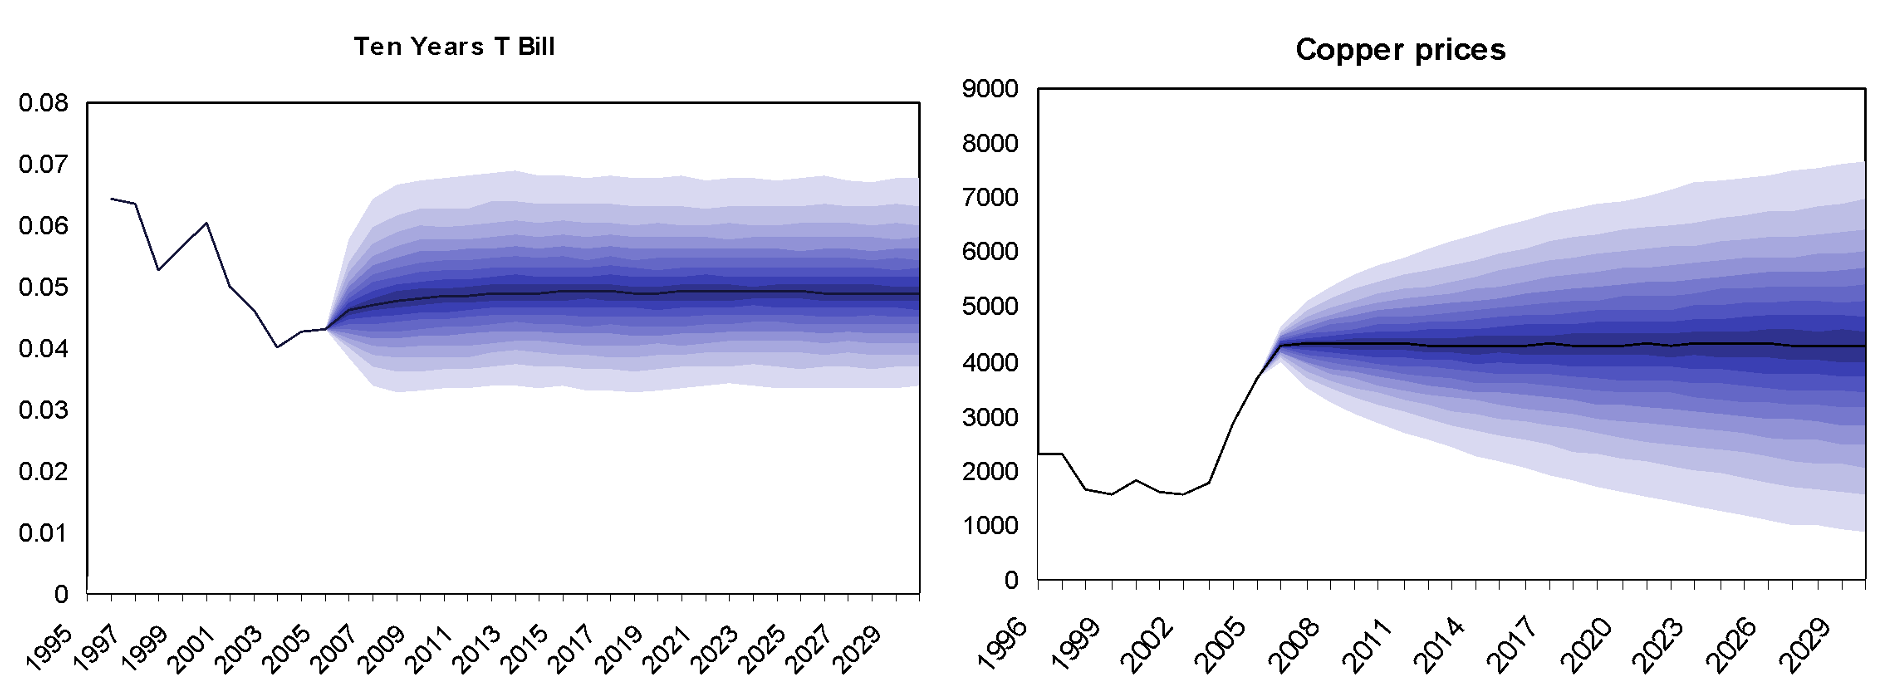
As an example, Figure 1 shows the results of this exercise for the case of Chile in 2005.
Figure 1 Chile 2005: VAR representation of driving variables
Note: Fan chart of 5,000 replications by bootstrapping the VAR residuals for three variables estimated with coefficients in Table A1. RER is the real exchange rate.
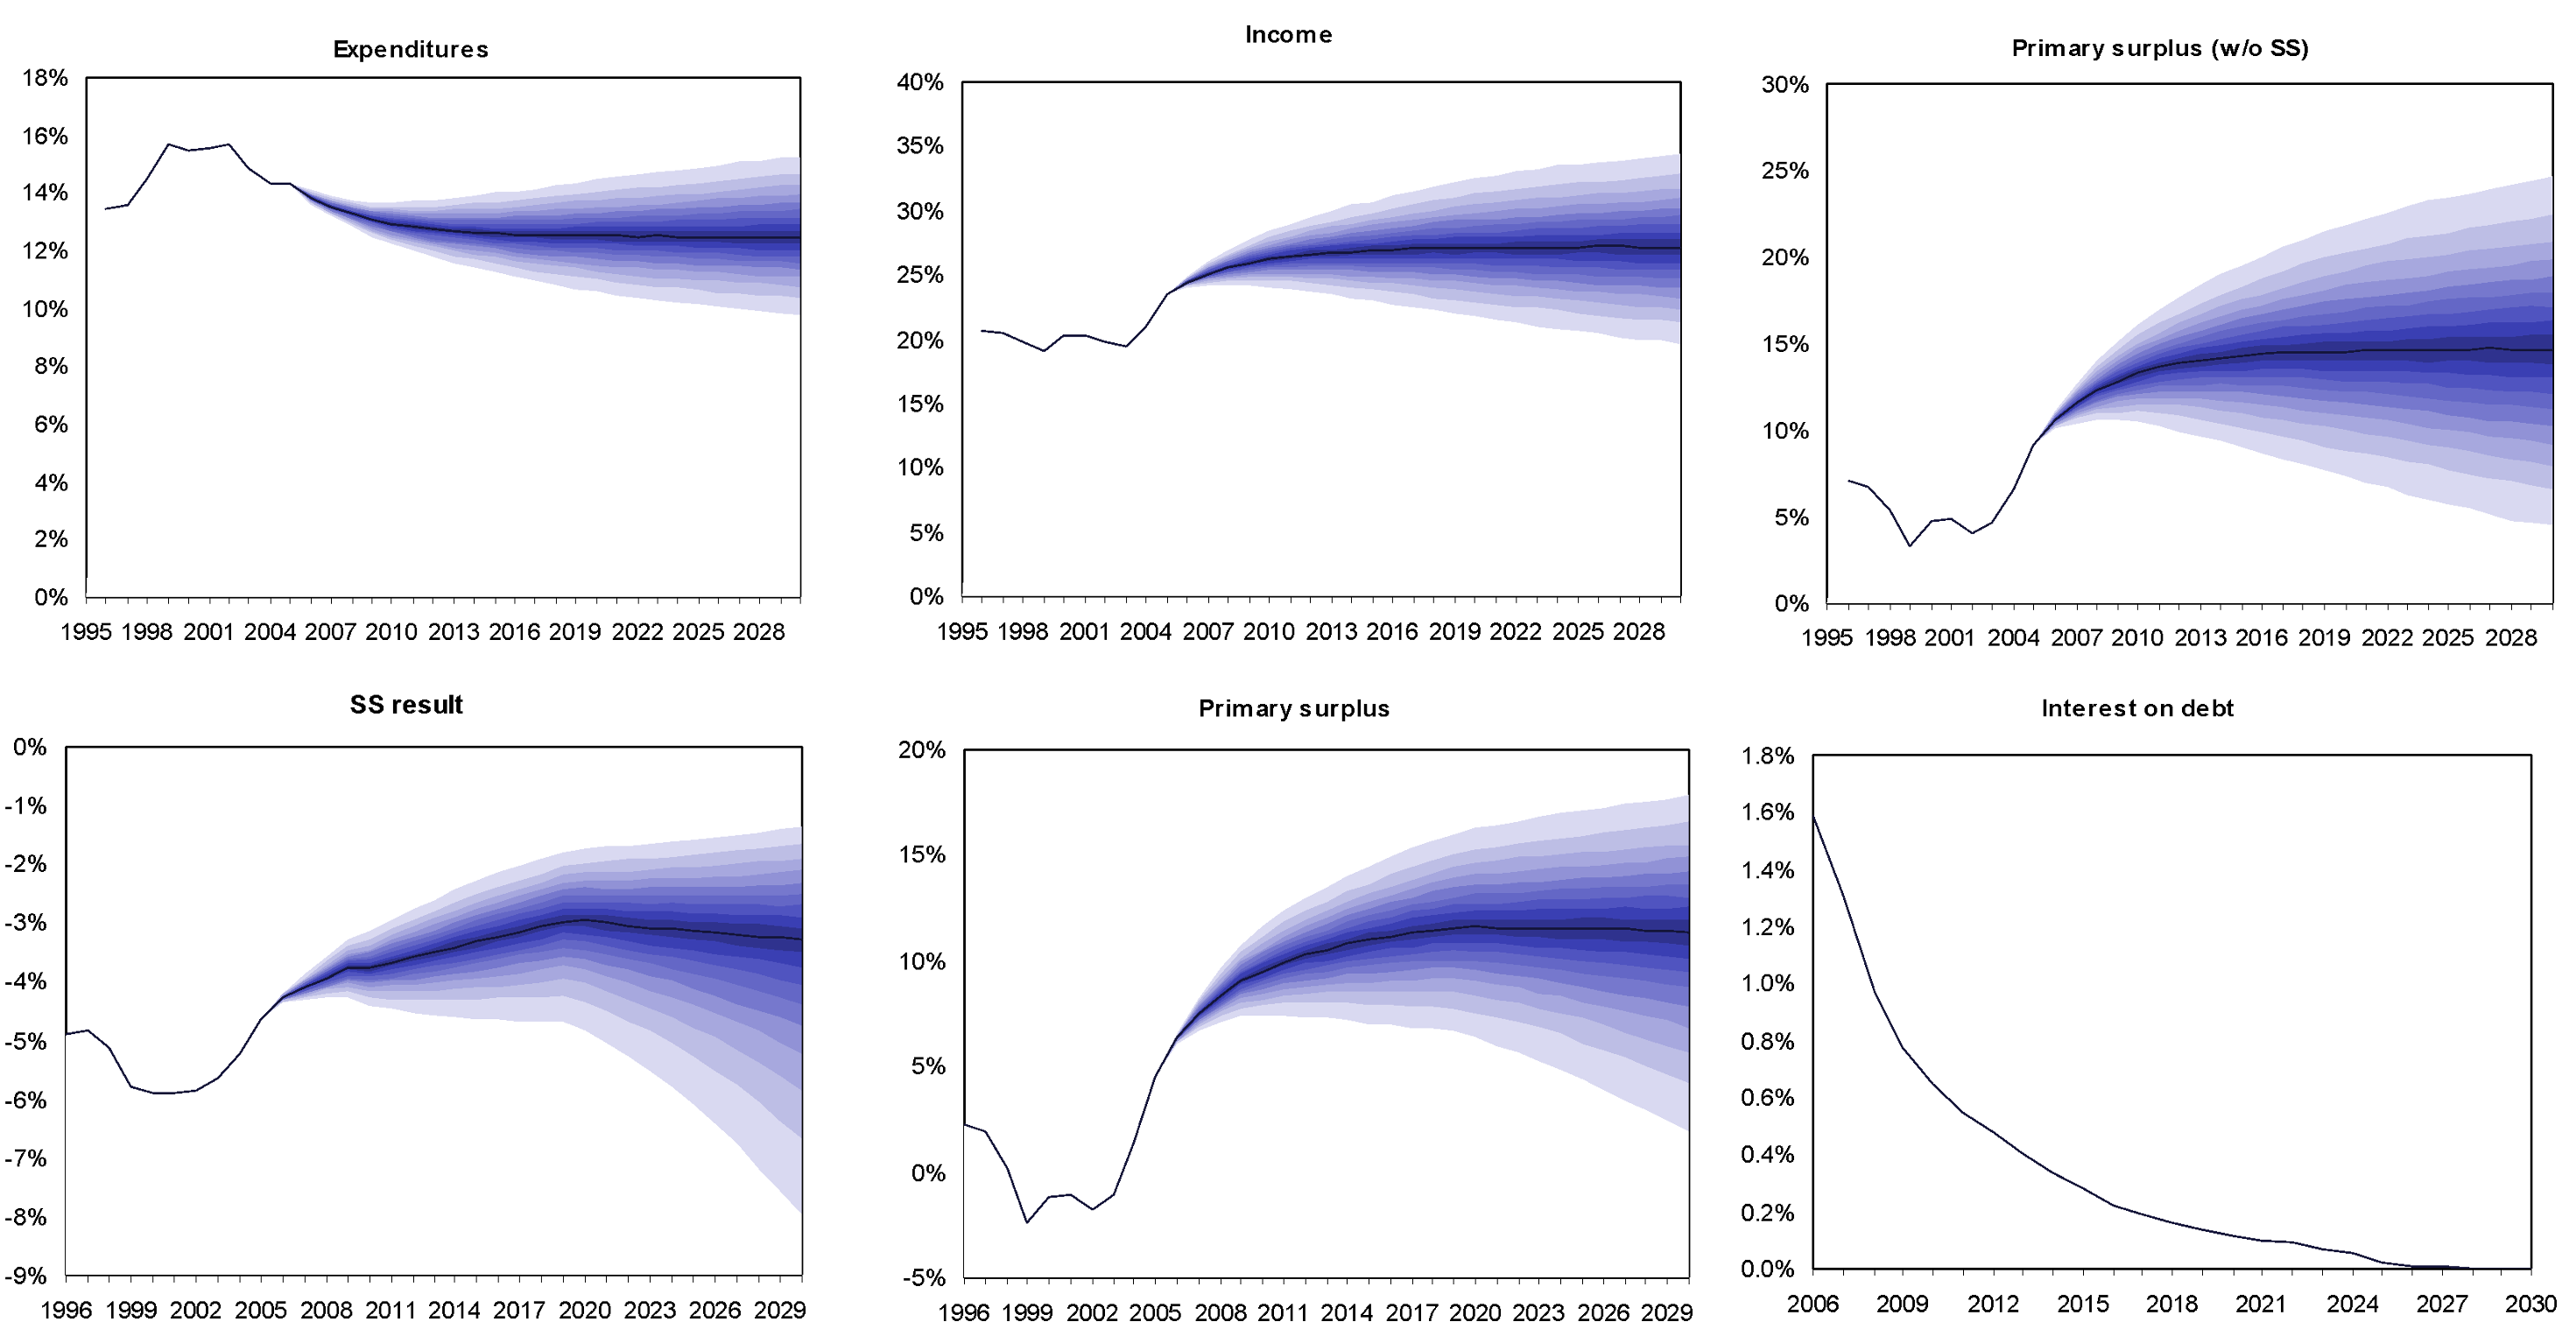
These simulations are used to generate a stochastic representation of income and expenditure that, combined with the response functions estimated in step 2, allows us to simulate the fiscal balance flow (Figure 2).
Figure 2 Chile 2005: Expenditures and income (as % of GDP)
Note: Fan chart with 5,000 replications of drivers and their effects on income and expenditure variables as per Tables 2.a and 2.b. Interest payments are known ex-ante and thus certain. SS refers to social security expenditures.
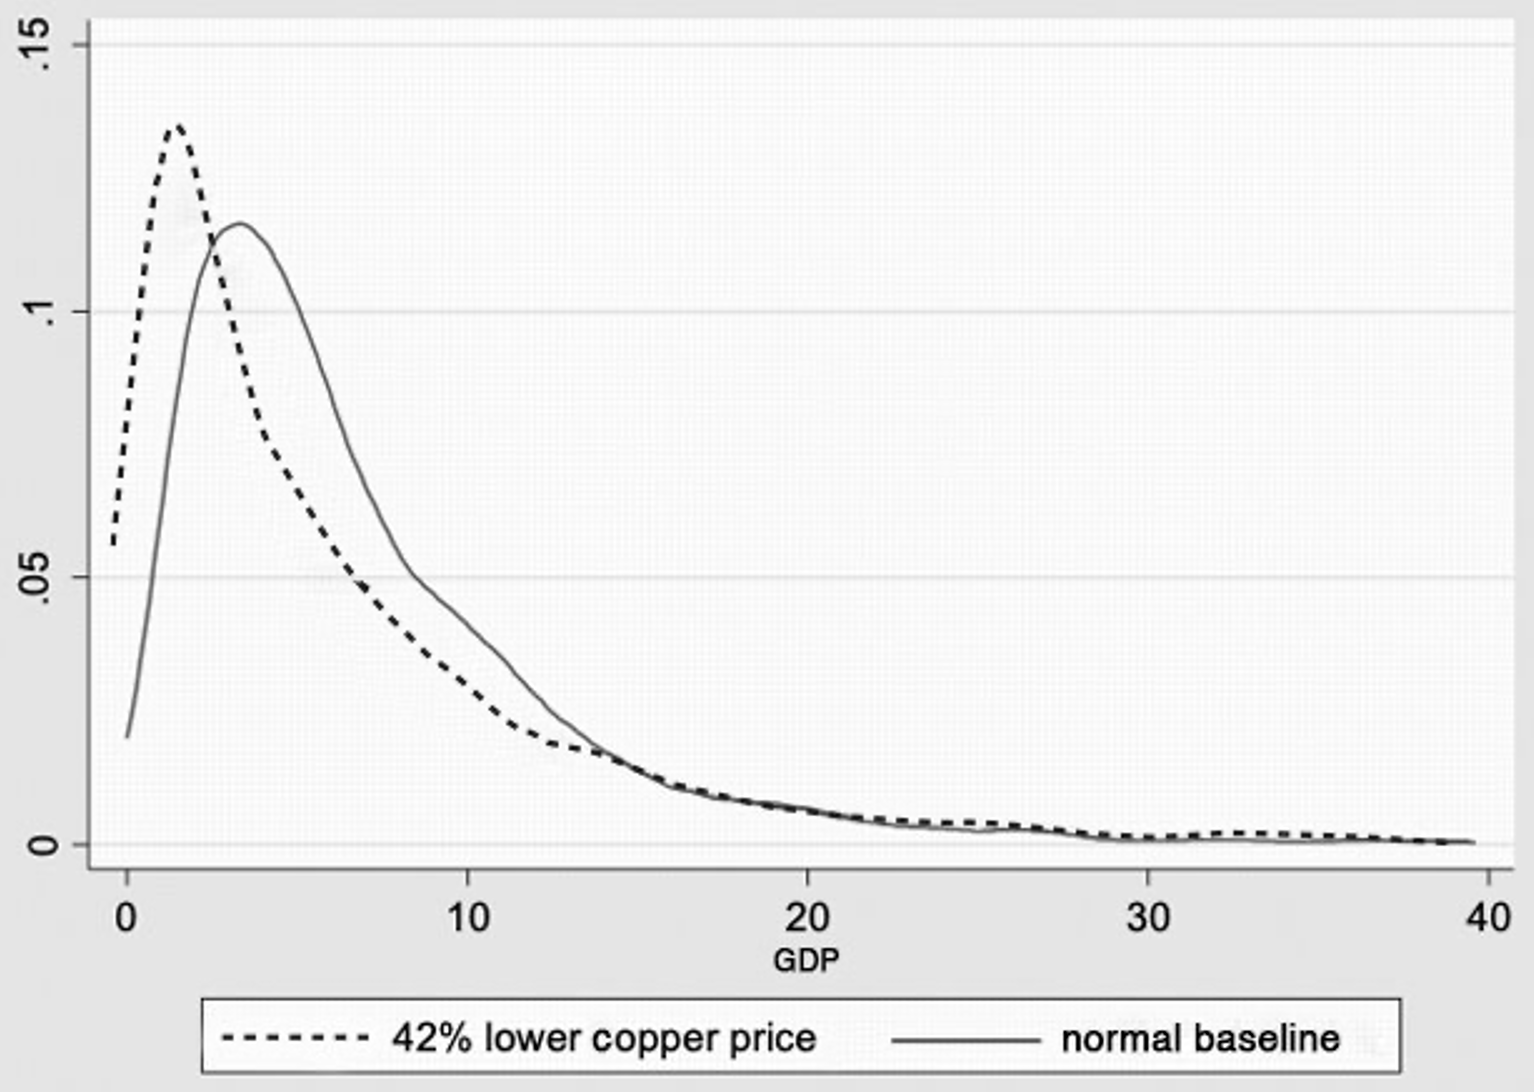
The net worth can then be computed by aggregating the income and expenditure flows simulated in step 3 into a sequence of primary surpluses, discounting the result to obtain the net present value. The definition of the discount rate r is crucial. In our simulations, we assume solvency (zero credit risk premium) to rule out self-fulfilling liquidity runs that may eventually push the country into insolvency, and compute net worth based on the international risk-free rate for each of the 5,000 simulated paths (Figure 3).
Figure 3 Chile 2005: Impact of a change in the price of copper
Note: Histogram of government net worth for each of the 5,000 paths for drivers and income and expenditure variables discounted at the international interest rate for Chile. Base case and a 42% lower copper price with the price modelled as a random walk.
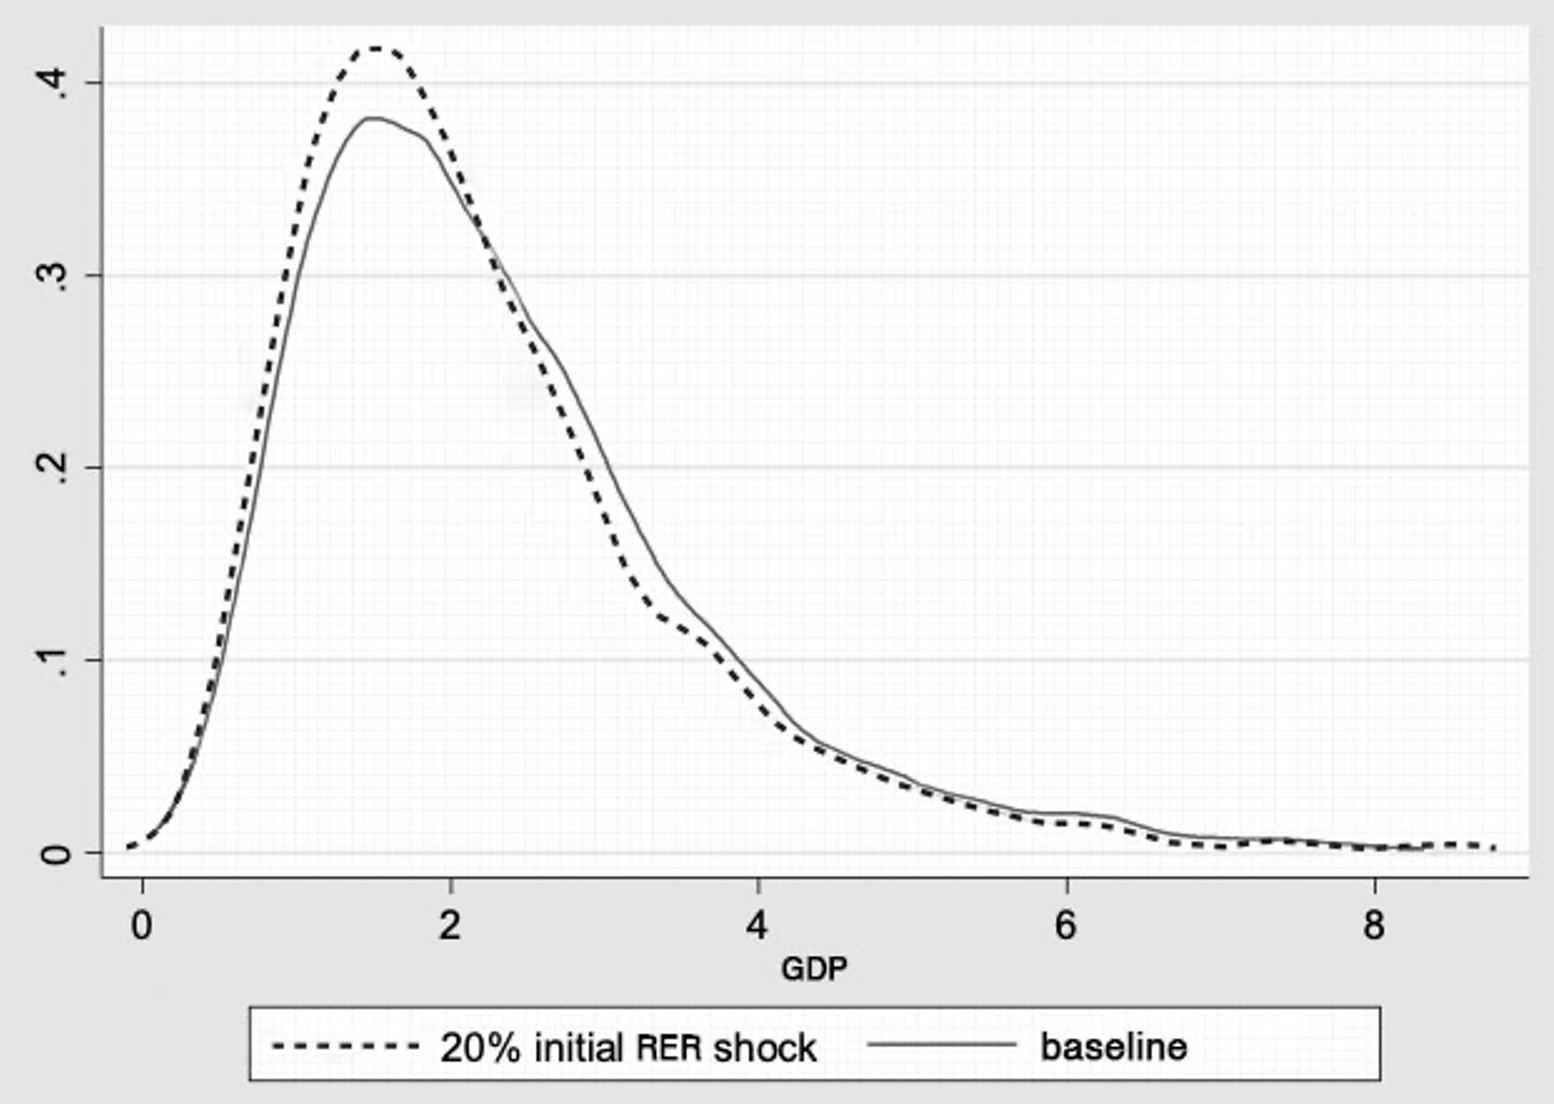
The model can be used to evaluate the fiscal sensitivity to large shocks to the drivers. As expected, a persistent (random walk) shock may shift the distribution significantly. In Figure 4, we replicate the exercise for Argentina for the same year (2005) to illustrate one way in which the balance sheet approach deviates from traditional methods: the denomination of explicit and total liabilities often differs substantially. A permanent 20% real depreciation, which would drive up debt ratios significantly, yields almost no change in net worth because valuation changes in foreign currency-denominated debt are offset by the benign effect of the devaluation on foreign currency-related revenues (particularly export taxes).
Figure 4 Argentina 2005: Impact of a change in the real exchange rate shock
Note: Histogram of government net worth for each of the 5,000 paths for drivers and income and expenditure variables discounted at the international interest rate for Argentina. Base case and a 20% permanent depreciation of the local currency.
DSA versus the balance sheet approach: Tracking fiscal deterioration in South Africa
South Africa is a good case to look for a comparison, as the country has recently experienced a large swing in fiscal sustainability. A relatively continuous DSA is provided by the IMF's periodic Article IV assessments.
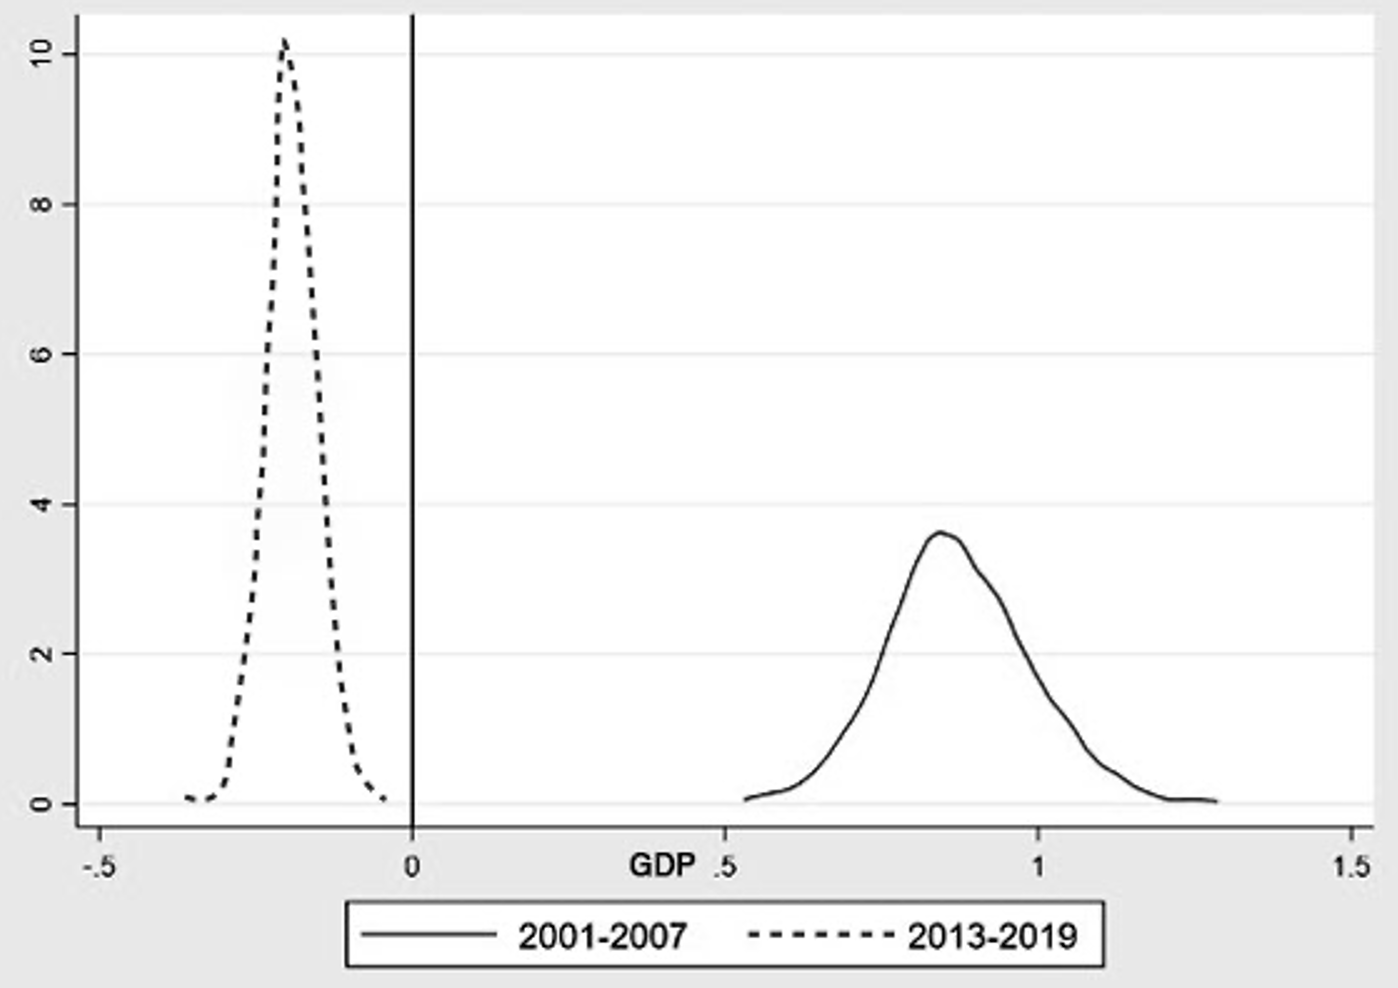
Figure 5 Balance sheet approach of South Africa, 2007 and 2019
Note: Histogram of 5,000 replications of drivers and income and expenditure variables discounted at the international interest rate for South Africa in 2007 and 2019.
The right panel in Figure 5 shows the balance sheet of the South African government in 2007, when the primary surplus was positive and debt-to-GDP ratios, below 30% at the end of the year, were relatively low. The left panel shows the distribution function for South Africa’s government net worth in 2019 as it was heading into COVID. By then, the government had run steady primary deficits and debt had increased to close to 70% of GDP. As a result of these changes, our analysis indicates that the South African government had become insolvent, a deterioration that matched the decline in credit quality as reflected in sovereign spreads and credit ratings during this period.
This deterioration is harder to find in traditional DSAs. Article IV reports stated that “South Africa’s public debt position remains sustainable” (2008), that “South Africa’s public debt position appears sustainable” (2011), that “the DSA framework suggests South Africa’s government debt-to-GDP ratio is sustainable in the baseline scenario, but remains vulnerable to shocks” (in 2016, after three credit rating downgrades,) and that “sizable GEFNs [gross external financing needs] would keep South Africa’s external vulnerabilities elevated. […] a 30% currency depreciation could push external debt above 60% of GDP, …. However, other standard shocks simulated in the external debt sustainability analysis—such as a widening of the non-interest current account deficit, a deceleration in real GDP growth, and a rise in the interest rate—would lead to moderate increases in external debt” (in 2018).
Thus, traditional DSAs provided a much more muted account of the fiscal deterioration than a balance sheet approach (and market valuations and credit ratings).
The balance sheet approach is not without problems. As with DSA, results are sensitive to the assumptions, and cannot anticipate policy changes. Also, it requires more information than a traditional DSA, including estimates of balance sheet items that are often unavailable. But, by forcing the analyst to look at all assets and liabilities, it provides a complementary – an in our view, more objective – assessment as well as a concrete ‘solvency’ measure of sustainability (the net worth), thereby usefully complementing traditional approaches.
References
Abbas, S A, A Pienkowski and K Rogoff (eds) (2019), Sovereign Debt: A Guide for Economists and Practitioners Oxford University Press.
Arrow, K, P Dasgupta, L Goulder, G Daily, P Ehrlich, G Heal, S Levin, K-G Maler, S Schneider, D Starrett and B Walker (2004), “Are we consuming too much?”, Journal of Economic Perspectives 18(3): 147–72.
Chalk, N and R Hemming (2000), “Assessing fiscal sustainability in theory and practice”, IMF Working Paper WP/00/81.
Cowan, K, E Levy Yeyati, U Panizza, and F Sturzenegger (2006), “Sovereign debt in the Americas: new data and stylised facts”, Inter-American Development Bank (IADB) Working Paper 577.
Debrun, X, J Ostry, T Willems and C Wyplosz (2019), “Public debt sustainability”, In S A Abbas, A Pienkowski and K Rogoff (eds), Sovereign Debt: A Guide for Economists and Practitioners, Oxford University Press.
Forni, L and P Turner (2021), “Global liquidity and dollar debts of emerging market corporates”, VoxEU.org, 15 January.
IMF (2008), “South Africa: 2008 Article IV consultation”, IMF Country Report 08/348.
IMF (2011), “South Africa: 2011 Article IV consultation”, IMF Country Report 11/258.
IMF (2016), “South Africa: 2016 Article IV consultation”, IMF Country Report 16/217.
IMF (2018), “South Africa: 2018 Article IV consultation”, IMF Country Report 18/246.
IMF (2021), “Review of the debt sustainability framework for market access countries”, IMF Policy Paper.
Levy Yeyati, E (2021), “Financial dollarisation and de-dollarisation in the new millennium”, Latin American Reserve Fund.
Levy Yeyati, E and F Sturzenegger (2023), “A balance-sheet approach to fiscal sustainability”, Fiscal Studies, 2023.
World Bank (2019), “Developing a medium-term debt management strategy framework (MTDS)”.
