There has been extensive debate on the economic consequences of the war on Ukraine and on how best to support its reconstruction (see the VoxEU debate on the economic consequences of war). In this column, we consider some lessons from past reconstruction episodes. As documented in more detail in Chapter 1 of the EBRD Transition Report 2022-23, Business Unusual (EBRD 2022), the economic effects of wars vary widely. While a typical war sees GDP per capita drop by 9% relative to its pre-war level (while inflation increases, as also documented by Chankova and Daly 2021), the most damaging wars erode income levels massively, by between 40% and 70%.
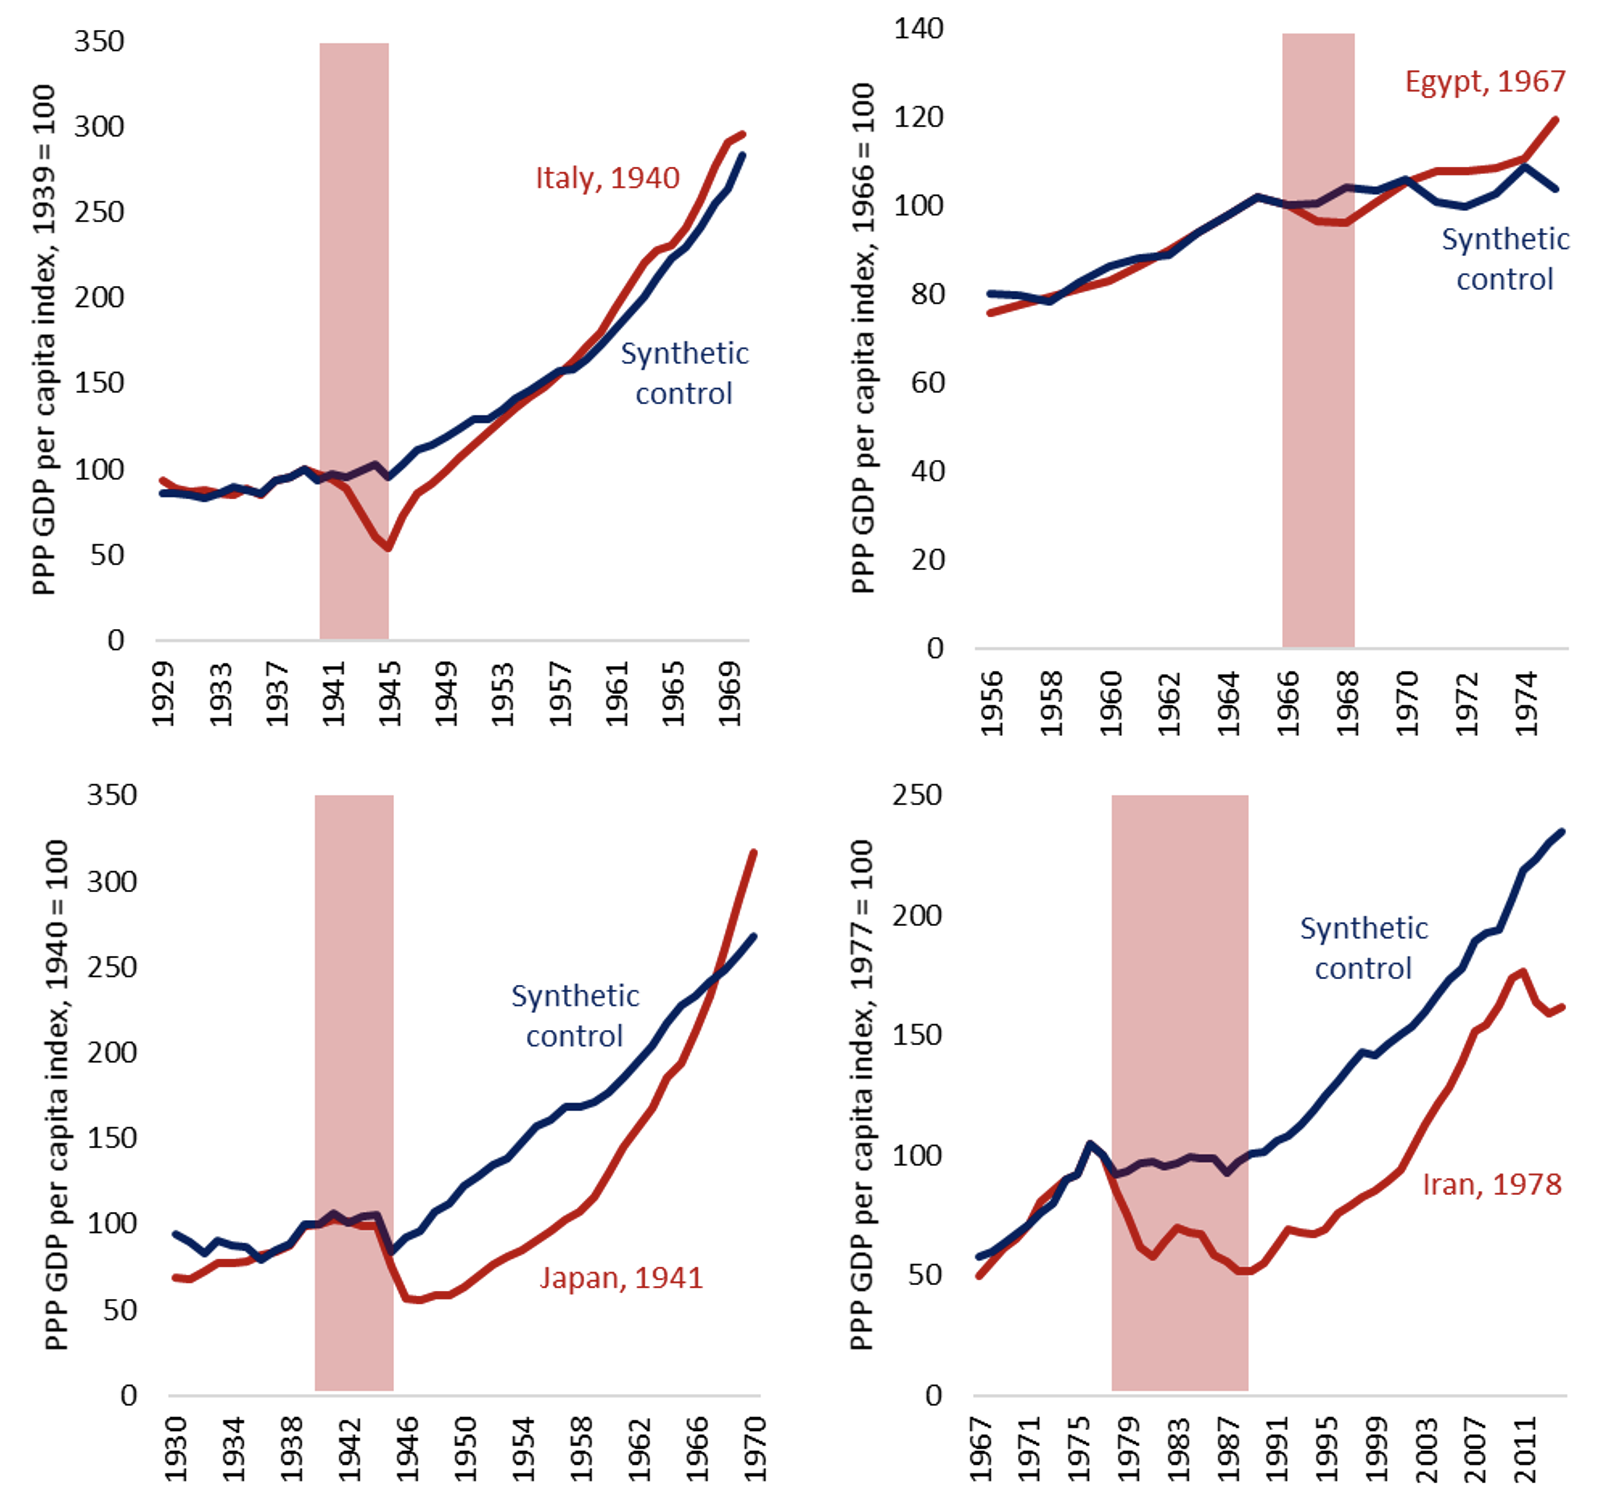
Post-war recovery paths also vary tremendously, even accounting for variation in economic damage (Figure 1). Sometimes, as in the case of Italy after WWII, growth accelerates significantly compared with the pre-war trend. In other instances, such as Egypt in the 1970s, the economy returns to its counterfactual growth path within a few years of the war ending. However, in many other cases, recoveries take decades. For instance, Japan’s reconstruction after WWII, often held up as an example of successful rebuilding, saw the country take 23 years to return to the GDP per capita trend observed in a synthetic comparator. In some cases, income never returns to the trend levels observed in comparators (as seen, for example, in Iran after the Islamic Revolution and the Iran-Iraq War of the 1980s). Recoveries are particularly slow when interrupted by further wars (as in the case of Greece’s recovery after WWI, which was interrupted by WWII and a civil war).
Figure 1 Post-war reconstruction experiences vary widely across countries
Sources: Correlates of War, Maddison Project Database, and authors’ calculations.
Notes: The synthetic control is created based on similarity of GDP per capita, population, and economic growth in the period before war on a sample of all economies not at war.
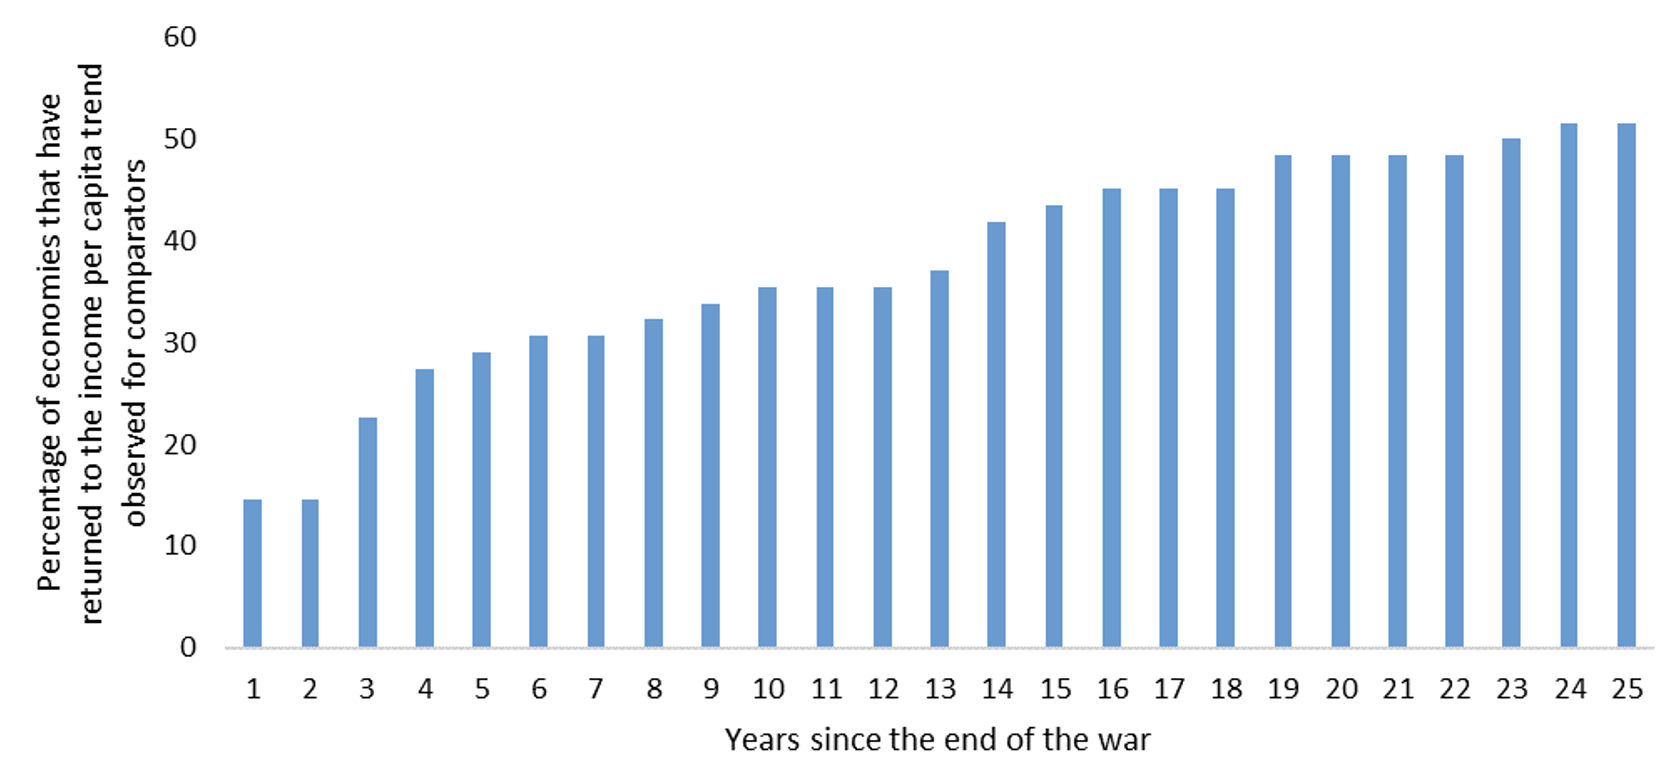
This diversity is illustrated more generally in Figure 2, which is based on a large sample of wars with drops of at least 5% in income per capita during or immediately after the war (drawing on the Correlates of War database and the Maddison Project Database). Wars that are preceded by another war in the previous five years are excluded. In 29% of those cases, GDP per capita returns to the trend levels observed for comparator economies within five years; however, in almost half of all cases income per capita remains below trend even a quarter of a century later.
Figure 2 In almost half of all cases, GDP per capita remains below its counterfactual growth path 25 years later
Sources: Correlates of War, Maddison Project Database, and authors’ calculations.
Notes: This chart indicates the cumulative percentage of economies that took t years or less to reach the level of GDP per capita that would be expected on the basis of the economic growth of their comparators (which are economies that were not at war in the five years before or after the war in question). Wars that are followed by less than 25 years of data are excluded.
Our analysis also looks at how the length of the post-war recovery correlates with (1) pre-war conditions (the strength of economic growth and the quality of democratic institutions); (2) the severity, length, and nature of the war; and (3) the reoccurrence of hostilities after the initial conflict (see also Poast 2006).
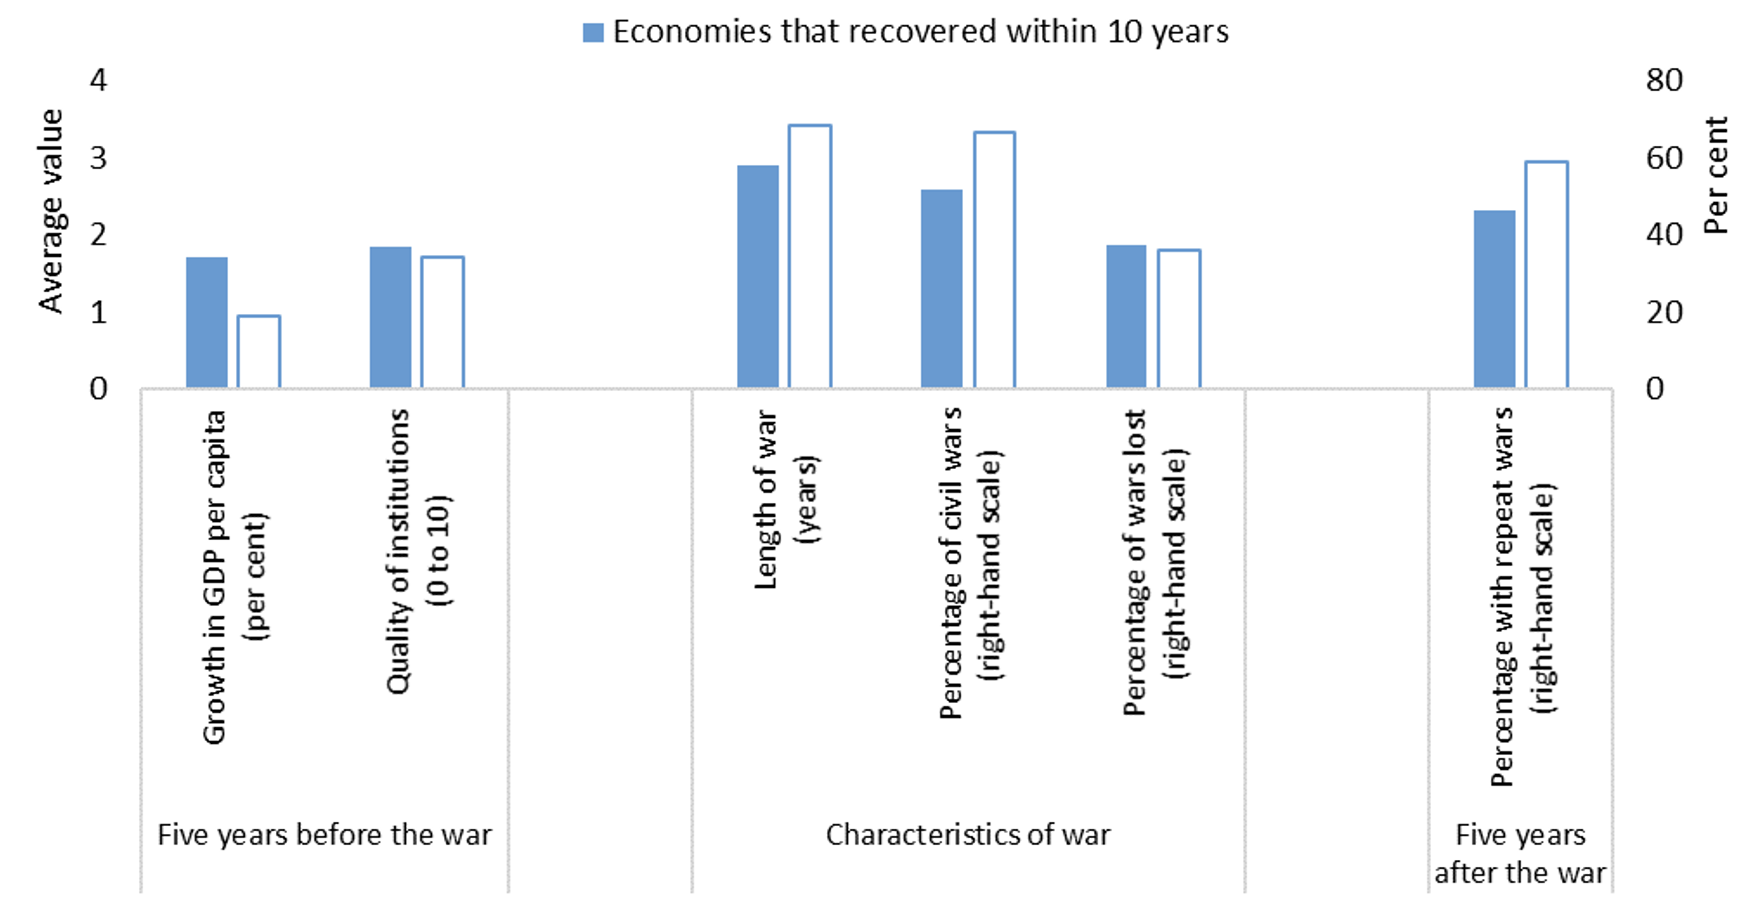
A simple analysis comparing economies whose income per capita returned to the trend levels observed for comparators within ten years (as seen in around one-third of all cases), with economies whose income per capita did not recover within ten years, suggests that such full recoveries are more likely to happen: (1) in economies with stronger GDP per capita growth and higher-quality democratic institutions before the war; (2) after shorter wars; (3) where wartime drops in GDP per capita are smaller, and (4) where there is no return to hostilities after the end of the war. Full recoveries are also observed less frequently after civil wars (see Figure 3).
Figure 3 Full recoveries are less likely in weaker economies and after civil wars
Sources: Correlates of War, Maddison Project Database, V-Dem database, and authors’ calculations.
Notes: This chart shows simple averages for (i) economies where GDP per capita returned within ten years to the trend levels that could be expected on the basis of the experiences of comparator economies and (ii) economies where GDP per capita did not return to those levels within ten years. A ‘repeat war’ is another war taking place within five years of the end of the original conflict.
Historical experiences show that reconstruction is particularly difficult if peace is fragile. After protracted or unresolved conflicts and fragile settlements, the threat of a return to conflict and continued security issues increase the cost of reconstruction (as seen, for instance, in Afghanistan and Iraq; see Special Inspector General for Afghanistan Reconstruction 2021, Matsunaga 2019).
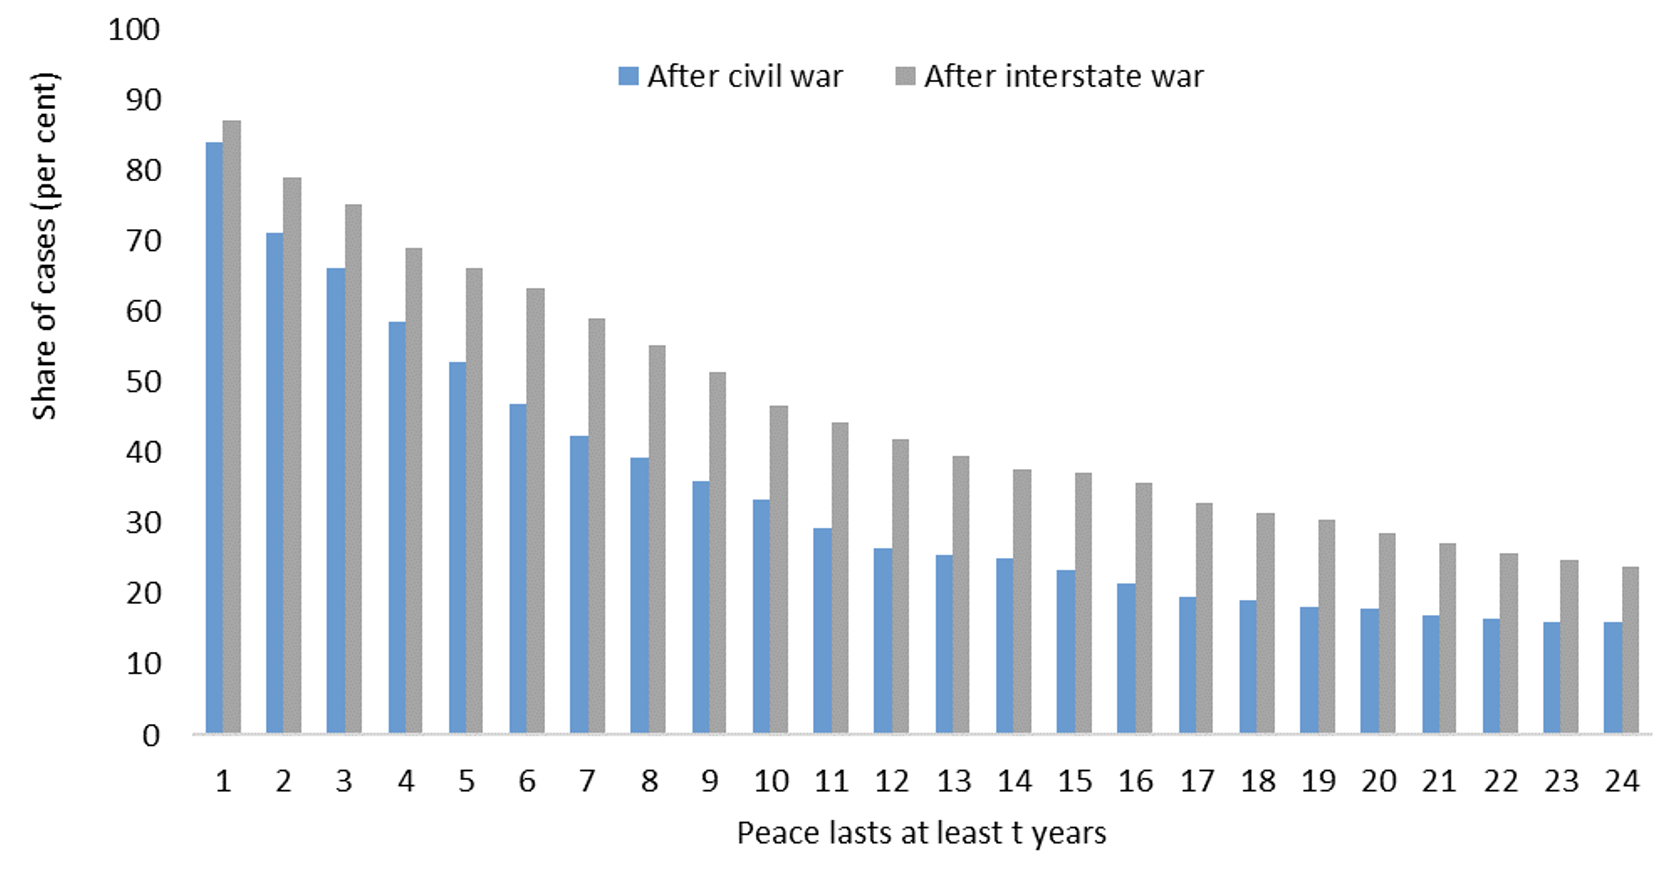
Indeed, wars frequently reoccur. Only around 20% of wars are followed by at least 25 years of peace. Strikingly, 53% of civil wars are followed by another war in the next six years (see Figure 4).
Figure 4 Only around 20% of wars are followed by at least 25 years of peace
Sources: Correlates of War and authors’ calculations.
Notes: Wars that are followed by less than 25 years of data are excluded.
War-time damage to infrastructure and other assets can be extensive, equivalent to two or three times pre-conflict GDP. Constantinescu et al. (2022) estimate that economic activity in Ukraine decreased by 45% at the beginning of the war and Blinov and Djankov (2022a) suggest that 7.5% of Ukraine’s productive capacity has been lost.
External aid can play an important role in supporting reconstruction (e.g. Blinov and Djankov 2022b on Ukraine). The US government spent 2% of the country’s GDP on the Marshall Plan (equivalent to $450 billion today) after WWII, which was widely credited with supporting post-war recovery and technological development in European economies (Eichengreen 2011). After the 1990-91 war in Kuwait, petroleum production and refinery capacity exceeded pre-war levels by 1994 thanks to extensive use of foreign contractors (Barakat and Skelton 2014, Shehabi 2015).
However, our results indicate that differences in the amount of external aid received (if any) explain only 10% of all variation in the number of years taken to recover (for economies that recovered fully within 25 years). Examples of countries that experienced both large amounts of investment and poor economic performance include Afghanistan (where the US alone spent $145 billion on reconstruction) and Iraq (where the international coalition spent $220 billion; see Becker et al. 2022a).
In part, the broad spectrum of outcomes reflects that, alongside lasting peace, the effective use of external aid requires sufficient local administrative capacity. External aid may be more effective if it is front-loaded to provide support in the critical early years of the post-war period when a recipient country’s own resources may be limited (Becker et al. 2022a). The use of grants, rather than loans, can limit further increases in government debt (Becker et al. 2022b). Grants accounted for 90% of Marshall Plan disbursement, for example.
Aid can also be more effective with domestic ownership and when administered by a dedicated agency, in order to reduce bureaucracy and ensure coordination across different sources. Clear sunset provisions, such as a predetermined multi-year lifespan, can allow for efficient budgeting, clustering of complementary programmes, and longer-term funding of infrastructure investment, while making the programme more politically palatable to donors and minimising ‘reconstruction fatigue’ (Becker et al. 2022b, Becker et al. 2022c).
References
Barakat, S and J Skelton (2014), “The Reconstruction of Post-War Kuwait: A Missed Opportunity?”, Kuwait Programme on Development, Governance and Globalisation in the Gulf States, No. 37.
Becker, T, B Eichengreen, Y Gorodnichenko, S Guriev, S Johnson, T Mylovanov, K Rogoff and B Weder di Mauro (2022a), A Blueprint for the Reconstruction of Ukraine, CEPR Press.
Becker, T, B Eichengreen, Y Gorodnichenko, S Guriev, S Johnson, T Mylovanov, K Rogoff and B Weder di Mauro (2022b), Macroeconomic Policies for Wartime Ukraine, CEPR Press.
Becker, T, O Bilan, Y Gorodnichenko, T Mylovanov, J Nell and N Shapoval (2022c), "Financing Ukraine's victory: Why and how", VoxEU.org, 29 September.
Blinov, O and S Djankov (2022a), "Assessment of damages to Ukraine's productive capacity", VoxEU.org, 21 September.
Blinov, O and S Djankov (2022b), "Ukraine's recovery challenge", VoxEU.org, 31 May.
Chankova, R D and K Daly (2021), "Inflation in the aftermath of wars and pandemics", VoxEU.org, 15 April.
Constantinescu, M, K Kappner and N Szumilo (2022), "Estimating the short-term impact of war on economic activity in Ukraine", VoxEU.org, 21 June.
EBRD (2022), Business Unusual, Transition Report 2022-23.
Eichengreen, B (2011), Lessons from the Marshall Plan, World Development Report, World Bank.
Matsunaga, H (2019), The Reconstruction of Iraq after 2003: Learning from Its Successes and Failures, MENA Development Report, World Bank.
Poast, P (2006), The Economics of War, McGraw-Hill/Irwin.
Shehabi, M R (2015), “An Extraordinary Recovery: Kuwait Following the Gulf War”, University of Western Australia Discussion Paper no. 15. 20.
Special Inspector General for Afghanistan Reconstruction (2021), “What We Need to Learn: Lessons from Twenty Years of Afghanistan Reconstruction.”
