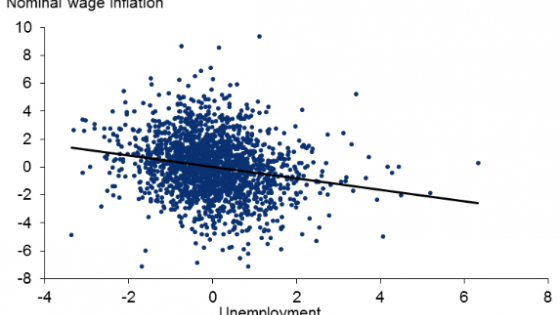
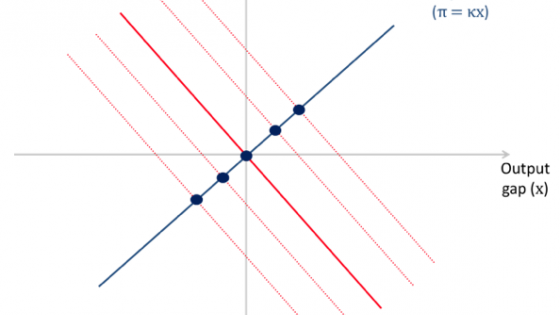
Prior to the onset of the COVID-19 pandemic in 2020, a substantial body of literature suggested that the Phillips curve exhibited a relatively flat slope (see, for example, Hazell et al. 2022). Consequently, it was widely believed that a temporary tightening of labour markets would have only a modest impact on inflation. This perspective, which was challenged by Mishkin et al. (2019) in a VoxEU column, has recently been subjected to considerable scrutiny following the inflationary episode from 2021 to 2023. During this period, inflation surged alongside high job vacancies and low unemployment, a phenomenon that has reignited the debate on the nonlinearity of the Phillips curve. Notably, Benigno and Eggertsson (2023) and Gitti (2024) have provided empirical evidence suggesting that the Phillips curve may exhibit strong nonlinearity, with inflation accelerating rapidly when the vacancy-to-unemployment ratio exceeds unity. Figure 1 replicates the typical raw US data, both at the national level and across Metropolitan Statistical Areas (MSAs).
Figure 1 Labour market tightness and inflation, raw data, 2000-2023
Notes: Each dot represents a quarter (Panel A) or a quarter-city (Panel B). Labour market tightness is measured as logθ, where θ=V/U. Inflation is quarter-to-quarter CPI core inflation (annualised). Light grey dots correspond to logθ<0, dark grey dots correspond to logθ≥0. The black line is the fitted cubic relation between inflation π and logθ, dotted lines delimit the 95% confidence interval. Sample is 2000Q1-2023Q4 for Panel A and 2000Q3-2024Q3 for Panel B.
In a recent Vox column, Zlobins (2025) attributes the stabilising effects of monetary policy during the recent tightening cycle to a significant increase in the frequency of price adjustments, which, in turn, implies an upward shift in the slope of the Phillips curve. This perspective suggests that labour market tightness played a crucial role in the inflationary surge observed in late 2021 and 2022, and that the subsequent easing of labour market conditions was instrumental in bringing inflation back down. More specifically, had the supply shocks induced by COVID-19 and related policies not been accompanied by labour market tightness, inflationary pressures would likely have been significantly lower, potentially reducing the necessity for an aggressive monetary policy response.
Given the importance of correctly interpreting recent inflationary dynamics, we investigate in Beaudry et al. (2025) the robustness of the empirical evidence supporting a nonlinear Phillips curve. Our findings suggest that the evidence is fragile, as reasonable alternative model specifications and data choices yield markedly different conclusions.
The stakes of this debate are high. An unwarranted prior belief in a highly nonlinear Phillips curve could result in suboptimal policy decisions. For instance, consider a future scenario characterised by supply shocks of similar magnitude to those observed during the COVID-19 crisis, but without the accompanying labour market tightness. A misinterpretation of the recent inflationary episode could lead policymakers to underestimate the necessity of a forceful monetary response, under the erroneous assumption that inflation will revert to target levels autonomously. Conversely, if the apparent nonlinearity in recent data is instead a reflection of de-anchored short-run inflation expectations, failure to recognise this could lead to an underestimation of the risk of inflation persistence in the absence of a robust monetary response.
Setting aside formal econometric estimation (see Beaudry et al. 2025), we highlight here some key empirical patterns that underscore both the plausibility and fragility of the nonlinear Phillips curve hypothesis. Figure 1 illustrates a pronounced nonlinear relationship between inflation and the vacancy-to-unemployment ratio. However, this observation does not establish causality. From a Phillips curve perspective, the inflation surge following the COVID-19 shock could have been driven by multiple factors, including cost-push shocks, inflation expectations, and labour market tightness. Disentangling these effects is challenging, given their simultaneous movements during the post-pandemic period. To visualise this simultaneity problem, Figure 2 presents the time series evolution of the aggregate vacancy-to-unemployment ratio (Panel A) and inflation, both actual and expected as measured by the Michigan Survey of Consumers (Panel B).
Figure 2 Labour market tightness, inflation, inflation expectations, 2000-2023
Panel A) Labour market tightness
Panel B) Inflation and inflation expectations
Notes: Labour market tightness is measured as θ=V/U. Inflation π is quarter-to-quarter CPI core inflation (annualised). Expectations are one-year-ahead and obtained from the Michigan Survey of Consumers. Grey areas represent quarters with θ≥1. Sample is 2000Q1-2023Q4.
The data reveal that inflation expectations tended to be elevated precisely when labour market tightness was high, suggesting that inflation dynamics may have been driven, at least in part, by short-run de-anchoring of expectations in response to supply shocks. Beaudry et al. (2024) further develop this argument.
To explore whether the observed nonlinearity is confounded by inflation expectations, we employ an expectations-augmented Phillips curve framework, as originally formulated by Phelps (1967) and Friedman (1968). The importance of inflation expectations was a central lesson from the inflationary episode of the 1970s. In Figure 3, we reexamine the data, incorporating a New-Keynesian Phillips curve specification by plotting inflation minus .99 times one-year-ahead inflation expectations (obtained from the Michigan Survey of Consumers) against the log of labour market tightness. Results are displayed for both aggregate and MSA-level data.
Figure 3 Inflation and labour market tightness with expectations, 2000-2023
Notes: Each dot represents a quarter. Dark dots indicate observations with logθ≥0 and light dots observations with logθ<0. Inflation is quarter-to-quarter CPI core inflation (annualised). The measure of inflation expectations π_(t+1)^e is the national Michigan Survey of Consumers one year-ahead inflation expectation (adjusted to obtain one quarter-ahead expectation). The black line is the fitted cubic relation between the y-axis variable and logθ, dotted lines delimit the 95% confidence interval. Sample is 2000Q1-2023Q4.
Once inflation expectations are accounted for, the previously striking nonlinearity observed in Figure 1 largely disappears. In panel A, representing aggregate data, nonlinearity also dissipates when alternative household and firm-based expectation measures — such as the Federal Reserve Bank of New York’s Survey of Consumer Expectations or the Federal Reserve Bank of Cleveland’s Survey of Firms’ Inflation Expectations — are used. However, the nonlinearity persists when expert-based inflation expectations, such as those from the Survey of Professional Forecasters or the Livingston Survey, are employed. Notably, these expert-based measures significantly underpredicted inflation post-2020, whereas household and firm expectations were more aligned with actual outcomes (see Reis 2023 for a discussion on navigating different expectation measures). In panel B, which examines city-level cross-sectional data, the nonlinearity vanishes for any measure of inflation expectations when time-fixed effects are included, as suggested by theory (see Beaudry et al. 2025 for details).
Our empirical investigation suggests limited support for a nonlinear Phillips curve in cross-sectional data. In time-series data, controlling for inflation expectations largely accounts for the apparent nonlinearity. The only instance in which nonlinearity appears is in aggregate data when expert expectation measures — those that performed poorly in forecasting inflation post-2020 — are utilised.
Two competing interpretations of recent inflationary dynamics emerge from this analysis, and distinguishing between them remains challenging. Policymakers should exercise caution and refrain from prematurely adopting either view until more conclusive data or methodological advancements resolve the debate. On one hand, there is the view that – in addition to supply shocks – labour market tightness played a very important role in generating high inflation post-2020 because the Phillips curve is highly nonlinear, and the labour market was very tight. On the other hand, there is the view that the Phillips curve is likely quite flat and that a de-anchoring of short-run inflation expectations following the supply shocks likely played a central role in realised inflation dynamics. The main difficulty is differentiating between these two views, and weighting their respective merits, relates to the difficulty of knowing how to properly control for inflation expectations. Misinterpretation could lead to significant policy missteps, particularly in stagflationary scenarios.
References
Beaudry, P, C Hou and F Portier (2024), “Monetary Policy When the Phillips Curve Is Quite Flat”, American Economic Journal: Macroeconomics 16(1): 1-28.
Beaudry, P, C Hou and F Portier (2025), “On the fragility of the nonlinear Phillips curve view of recent inflation”, NBER Working Paper 33522.
Benigno, P and G B Eggertsson (2023), “It’s Baaack: The Surge in Inflation in the 2020s and the Return of the Non-Linear Phillips Curve”, NBER Working Paper 31197.
Friedman, M (1968), “The Role of Monetary Policy”, American Economic Review 58: 1-17.
Gitti, G (2024), “Nonlinearities in the Regional Phillips Curve with Labor Market Tightness”, Working paper, Collegio Carlo Alberto and University of Turin
Hazell, J, J Herreño, E Nakamura and J Steinsson (2022), “The Slope of the Phillips Curve: Evidence from US States”, The Quarterly Journal of Economics 137(3): 1299-1344.
Mishkin, F, A Sufi and P Hooper (2019), “The Phillips curve: Dead or alive”, VoxEU.org, 23 October.
Phelps, E S (1967), “Phillips Curves, Expectations of Inflation and Optimal Unemployment over Time”, Economica 34(135): 254-281.
Reis, R (2023), “Four Mistakes in the Use of Measures of Expected Inflation”, Discussion Papers 2302, Centre for Macroeconomics (CfM).
Zlobins, A (2025), “Monetary policy transmission in the euro area: Why this time it’s different”, VoxEU.org, 26 February.


