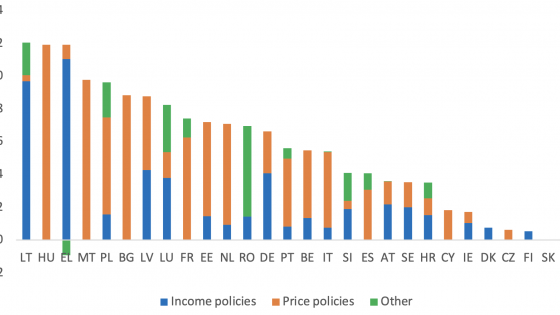
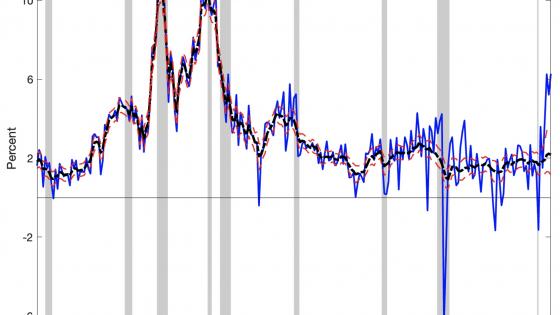
Inflation in the euro area has kept surprising on the upside, creating a significant challenge for macro-economic policy in a context of weakening growth prospects. In addition, the dispersion of inflation is at an all-time high. In August 2022, headline inflation ranged from 6.5% in France to 25.2% in Estonia (Eurostat 2022). Inflation spreads had already been widening since the start of the Covid-19 pandemic and the asymmetric impact of the surge in energy, commodity and food prices is further adding to this dispersion (Figures 1 and 2).
Inflation dispersion will make it even more difficult to ensure an efficient transmission of monetary policy across member states and to guarantee an effective coordination between monetary and fiscal policies. Combined with the asymmetric impact of potential shocks, such as further energy and commodity price hikes, this could lead to diverging economic trajectories if monetary policy, which is set at the euro area level, remains too loose for countries with very high inflation while it becomes too tight for countries with relatively low inflation rates (see for example Aksoy et al. 2002). In contrast, until 2019, inflation differentials had been relatively small across euro area countries and roughly in line with those across US census divisions or metropolitan areas (Figure 2, ECB 2021, Darvas and Wolff 2014).
Figure 1 Headline inflation in the euro area, July 2022
Note: Contributions to year-on-year harmonised price inflation are calculated as described in OECD (2022a) using national price inflation indices.
Source: Eurostat and OECD calculations, OECD (2022a), OECD calculation of contributions to overall annual inflation.
A first reason for these divergences in inflation rates is the differentiated impact of the Covid-19 crisis. The peak of the pandemic in 2020 resulted in very low prices that varied greatly across countries, leading to strong base effects when prices started to increase again. The different speeds of the reopening of European economies after various lockdowns triggered by the pandemic have also mechanically increased the spread of inflation rates over 2021-22. Looking at the three-year annualised change instead of the usual one-year change, the recent increase in the standard deviation appears less striking (Figure 2).
A second reason is the diverging effects of energy and commodity price spikes (Figure 1) (Boone and Elgouacem 2021, Blake and Bulman 2022, EC 2022). Retail energy prices increased by close to 40% over the year from August 2021 to August 2022 in the euro area. The share of energy in each country’s harmonised price index ranges from 6.7% in Malta to 16.2% in Latvia, with typically larger shares in Baltic and Eastern European countries. Similar differences exist for food. Moreover, the energy mix differs across countries, as does the extent of emergency price policies in reaction to the price spikes (Bethuyne et al. 2022).
Third, the current elevated level of dispersion reflects widening spreads in core inflation (Figure 2). While the standard deviation of core inflation rates across the euro area is broadly in line with its 2005-19 average for the 12 initial euro area countries (EA-12) in July 2022, it was 156% above average once Baltic and Eastern European countries are included. This is due to the different behaviours of both services and industrial goods prices (Figure 3), reflecting different impacts from supply disruptions and national labour markets.
Figure 2 Dispersion of headline and core inflation in the euro area
Note: Euro area 12 is the standard deviation across the 12 initial euro area countries. The time-varying composition is the standard deviation across (time-varying) euro area countries. The standard deviations are unweighted. For the US, the series represents the unweighted standard deviation across the nine US census divisions in 2019-22, back casted over 2002-18 using the standard deviation across the four census regions.
Source: Eurostat, BLS and OECD calculations.
Figure 3 Core inflation in the euro area, July 2022
Note: Contributions to harmonised price inflation are calculated as described in OECD (2022a) using national price inflation indices.
Source: Eurostat and OECD calculations, OECD (2022a), OECD calculation of contributions to overall annual inflation.
Persistent or stronger-than-expected commodity and energy price shocks could further raise inflation differentials. Based on the NiGEM macroeconomic model, the OECD June Economic Outlook estimated that a European embargo on Russian gas imports could add up to 1.1 percentage points to European inflation in 2023 (OECD 2022a).
Yet, this impact would likely be highly unequal. To shed light on the magnitude of this mechanism, an illustrative calculation assumes a 40% increase in wholesale gas prices and a 20% increase in wholesale oil prices with a pass-through to retail prices of 40% for oil, 13% for gas and heating, and 4% for electricity (Figure 4, EC 2022). Also, as the pass-through is likely higher when commodity prices are already high (and the capacity of firms to further reduce margins is smaller), an alternative simulation assumes a higher pass-through to retail prices of 50% for oil, 26% for gas and heating, and 8% for electricity. In both scenarios, cross-country differences only stem from the different weights of energy items in national consumption baskets. All things equal, the simulated national impacts of these global commodity price shocks appear to increase the standard deviation of headline inflation by around 2% (and 3% in the high pass-through alternative), compared to its historically high August 2022 level.
Figure 4 Illustrative direct effects of a hike in wholesale energy prices on harmonised inflation after one year
Effects of a 40% increase in wholesale gas prices and a 20% increase in oil prices, percentage points
Note: The calculation assumes a 20% increase in wholesale oil prices and a 40% hike for wholesale gas prices. The pass-through to retail prices of oil and gas is assumed constant across euro area economies at the median estimates of the EC (2022): 40% for oil, 13% for gas and heating, and 4% for electricity. To gauge the uncertainty around this scenario, an alternative scenario assuming a higher pass-through is simulated using the median pass-through estimates plus the interquartile ranges of the EC (2022): 50% for oil, 26% for gas and heating, and 8% for electricity.
Source: Eurostat, EC (2022), and OECD calculations.
Based on the analysis above, divergences in inflation rates seem mainly driven by the differentiated impact of the coronavirus crisis and energy shocks so far. As those factors are expected to be mostly temporary, and as long as the divergence in core inflation remains moderate, differences in inflation should come down eventually. This would facilitate the conduct of monetary policy and reduce the risk that the tightening euro area monetary stance exacerbates financial fragmentation amongst member states.
Second-round effects from the burst of inflation may also differ across countries and be a further source of inflation dispersion. Inflation differences can become more entrenched via expectations, but also depending on the functioning of labour markets (e.g. wage-price indexation mechanisms), as well as how rents, social benefits, regulated prices, and taxes are linked to inflation. In countries where inflation is particularly high and there are signs of excess demand, such as in the Baltic States and several Eastern European economies, a tighter fiscal stance should play a role in countering demand pressures, since area-wide monetary policy alone is unlikely to be sufficient.
Fiscal policy should also tackle the adverse distributional impacts of higher energy prices. Temporary fiscal measures can help moderate inflation pressures and may thus help anchor inflation expectations (OECD 2022a). However, as levels of public debt are already high and to avoid fuelling inflation further, policy action to help cushion the impact of higher energy prices should be well targeted. Means-tested transfers to households generally meet these criteria, even though finer targeting mechanisms that go beyond income, for example based on housing location and quality, should be developed (OECD 2022b). Also, fiscal support should not outlast the period of exceptional price pressures to avoid weakening longer-term price signals, which are critical for the energy transition.
Fiscal policy choices should ideally take into account potential spillovers to other member states, and the possible interactions with monetary policy. Fiscal and price-control measures are not equally well-designed and targeted across the euro area, which might reduce their effectiveness and possibly create distortions in competition. Common European guidelines can help avoid this.
A more long-term structural source of inflation divergence is the heterogeneous national economic structures that lead to asymmetric country-specific shocks (OECD 2021). Structural policies should help make the euro area more resilient to price shocks. Investment to improve the interconnection among national electricity grids would reduce energy costs and improve security. Improved storage capacity and diversification of energy sources would also limit volatility in oil and gas markets, including during the energy transition (OECD 2022a). More generally, Europe should implement reforms that aim for stronger cross-country convergence, notably in three main avenues: the resilience of labour markets, the strength of the single capital market, as well as fiscal integration (OECD 2021).
In conclusion, while at their highest levels since 2002, divergences in inflation rates have so far been mostly driven by temporary factors. The main immediate challenge for an even transmission of monetary policy is not diverging inflation but diverging bond yields. However, this optimistic scenario could be put at risk if inflation divergences become more entrenched. To avoid this, fiscal policy will need to be tightened appropriately in countries with excess demand while structural reforms need to be implemented more generally to facilitate cyclical convergence across member states.
References
Aksoy, Y, P De Grauwe and H Dewachter (2002), “Do asymmetries matter for European monetary policy?”, European Economic Review 46.
Blake, H and T Bulman (2022), “Surging energy prices are hitting everyone, but which households are more exposed?”, ECOSCOPE, 10 May.
Bethuyne, G, A Cima, B Döhring, Å J Lindén, R Kasdorp and J Varga (2022), “Targeted income support is the most social and climate-friendly measure for mitigating the impact of high energy prices”, VoxEU.org, 6 June.
Boone, L and A Elgouacem (2021), “At the cross-roads of a low-carbon transition: what can we learn from the current energy crisis?”, ECOSCOPE, 22 October.
Darvas, Z and G B Wolff (2014), “So far apart and yet so close: should the ECB care about inflation differentials?”, Bruegel Policy Brief, 21 September.
EC (2022), “Box 1.2: An update on energy price developments: pass-through from wholesale to retail”, Winter 2022 (Interim) Forecast.
ECB (2021), “The need for an inflation buffer in the ECB’s price stability objective – the role of nominal rigidities and inflation differentials”, ECB Occasional Paper Series, No. 279, September.
Eurostat (2022), “Euro area annual inflation up to 9.1%”, Eurostat, 31 August.
OECD (2021), OECD Economic Surveys: Euro Area 2021, OECD Publishing, Paris.
OECD (2022a), OECD Economic Outlook, Volume 2022 Issue 1: Preliminary version, OECD Publishing, Paris.
OECD (2022b), As Energy Price Hikes Persist, Better Targeting of Support Becomes Imperative, OECD Publishing, Paris, forthcoming.


