Inflation in the euro area peaked at 10.6% in October 2022. Governments scrambled to cushion the economic and social fallout from the rising prices. They adopted measures to limit the increase in prices, particularly for energy, by introducing price caps, subsidies or discounts, and VAT reductions (‘price measures’). Governments also adopted fiscal measures to support households’ disposable income more directly, for example in the form of transfers or tax credits (‘income measures’). In the euro area, these inflation-related measures are estimated to have amounted to close to 2% of GDP in 2022 (Bańkowski et al. 2023).
A growing number of contributions have investigated the distributional impact of the inflationary shock and, in some cases, of the government fiscal measures in individual EU countries (Basso et al. 2022, Menyhert 2022, Curci et al. 2023, Bonfattia and Giarda 2023). These studies typically employ household budget surveys data to study the impact of inflation on different types of households based on their consumption. Curci et al. (2023) and Bonfattia and Giarda (2023) also use micro-simulation models to assess the impact of government measures in Italy. In a recent paper with colleagues from Eurosystem central banks and the European Commission, we assess the impact of these fiscal measures in a comparative static
cross-country exercise using EUROMOD, the tax-benefit microsimulation model of the EU (Amores et al. 2023). The study covers the four largest euro area countries as well as Portugal and Greece. To the best of our knowledge, our paper is the first to assess the cushioning effect of the policy measures in a comparative way across euro area economies.
The impact of inflation and compensatory fiscal measures on household distribution and welfare
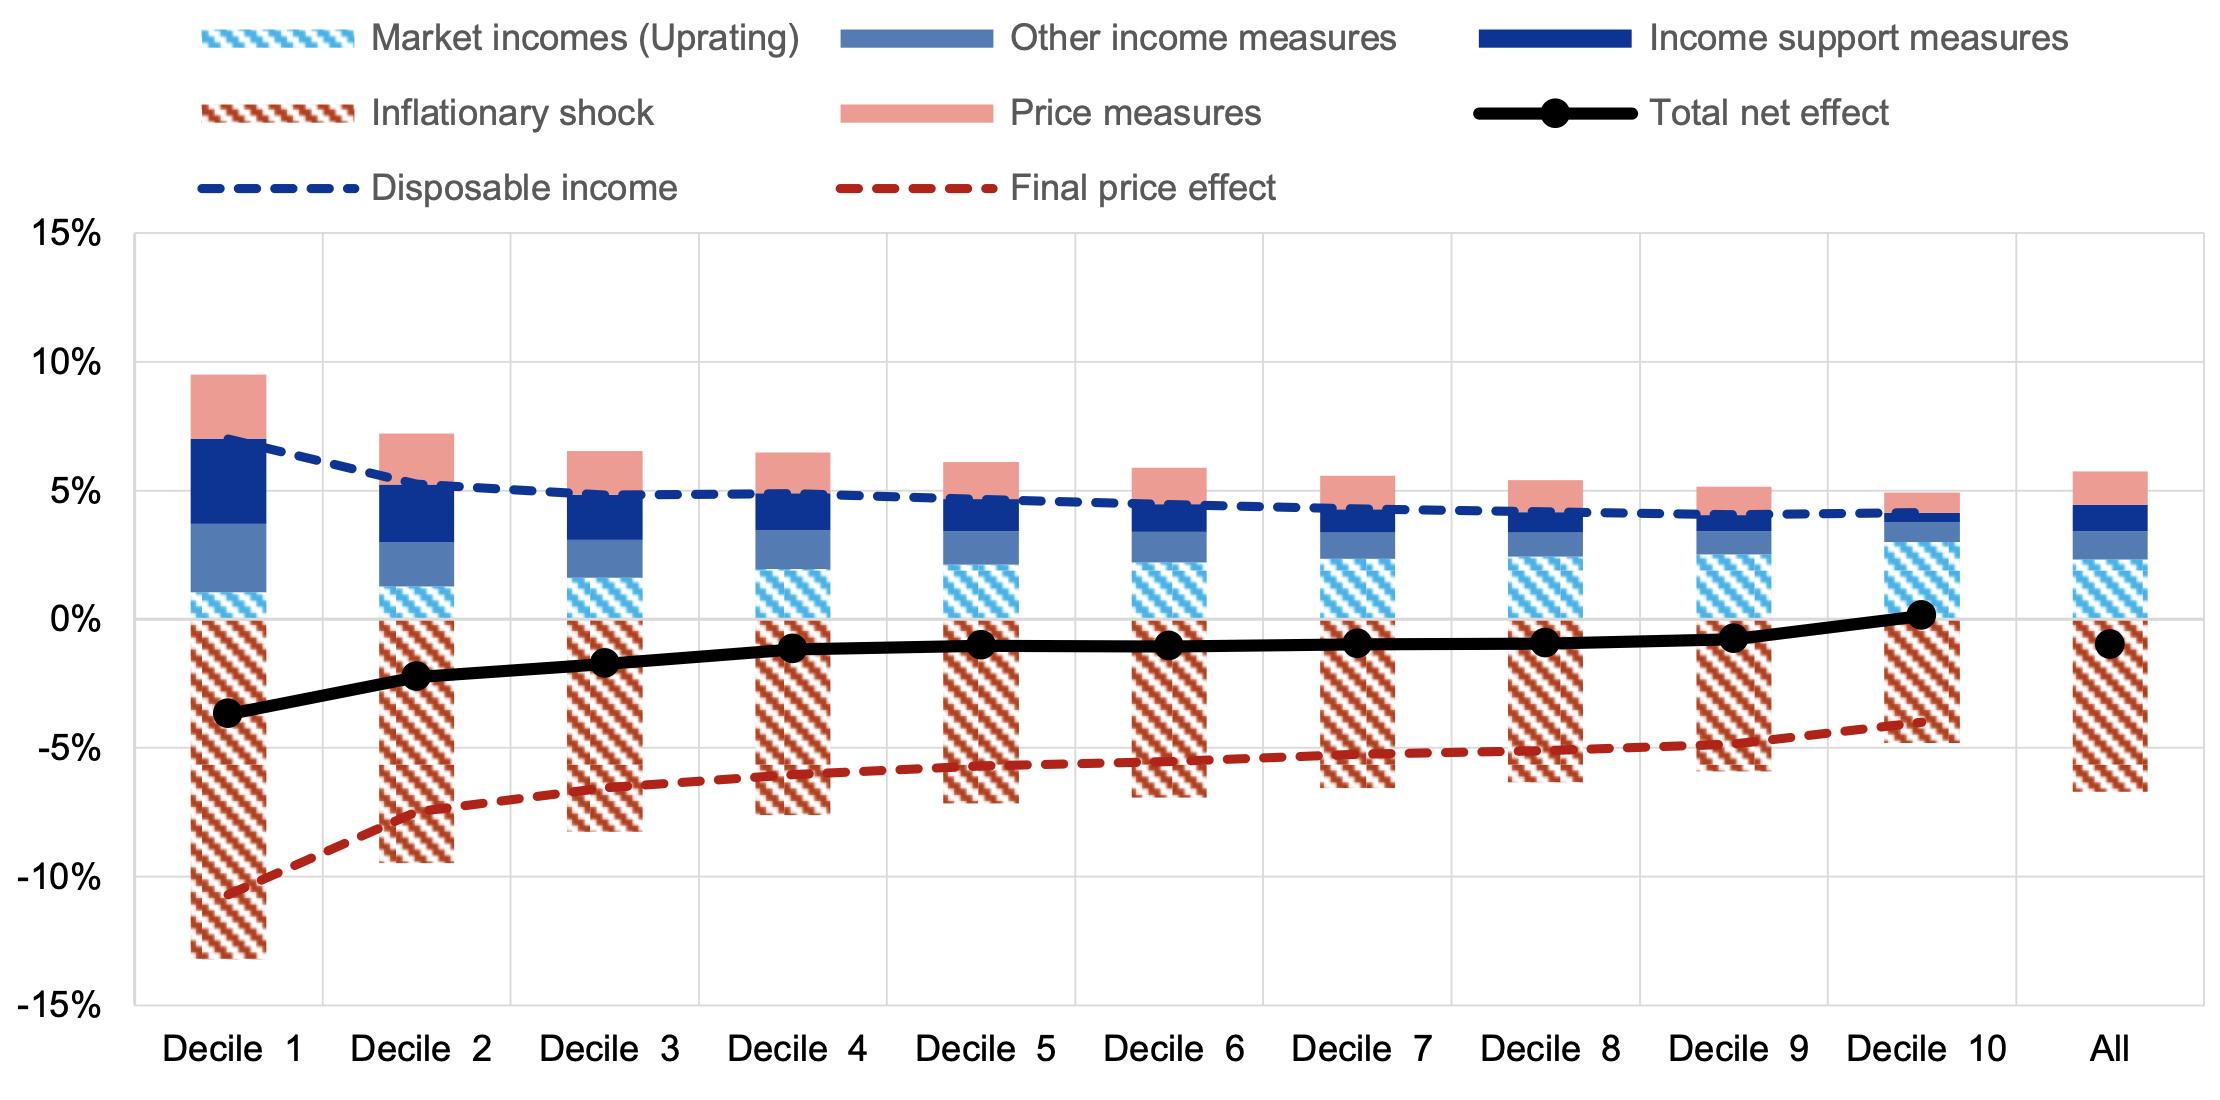
By itself, consumer inflation in 2022 would have had a detrimental impact on households in the euro area. Average household welfare would have dropped by almost 6.7 percentage points in income equivalent units,
with households in the lowest income decile suffering significantly more than those in the richest decile (Figure 1).
Differences in the impact of the inflationary shock on household welfare across the income distribution are driven by two factors. First, differences in consumption behaviour imply that households face different effective rates of inflation. Lower income households have faced a higher subjective rate of inflation on account of their higher share of energy and food in consumption (Charalampakis et al. 2022).
Second, and more importantly, poorer households consume a larger share of their income than richer households. Therefore, they are more severely affected by the increase in consumer prices.
Taken together, these two effects imply that in the euro area the welfare loss for the lowest income decile was 13.2%, which is 8.4 percentage points higher than the welfare loss for the highest income decile (4.8%).
At the same time, government measures, as well as nominal wage growth, mitigated the negative welfare effect of the inflation surge to a significant degree. In particular:
- Price measures have reduced the rise in inflation by about 1.6 percentage points.
Notably, while caps on prices or VAT reductions cannot be targeted to particular households, low-income households benefitted more in relative terms, given their higher exposure to energy price inflation.
- At the same time, income measures explicitly linked to the surge in inflation accounted for a 1 percentage point increase in disposable income growth. In contrast to the price measures, these were targeted much more to the lower-income households. In the lowest decile, they accounted for almost half of disposable income growth.
- The third element that offsets the increase in inflation was nominal income growth from market income as well as from government measures not explicitly related to the surge in inflation (e.g. pension and unemployment benefit increases).
Overall, these factors offset around 85% of the welfare loss for the average euro area household. At the same time, government measures, particularly on the income side, contributed to closing more than half of the gap in the welfare loss between the lowest and highest income decile.
Figure 1 Price and income effects based on households’ welfare (% change in equivalised disposable household income, 2021, per decile)
Source: Amores et al. (2023).
Notes: Market outcomes (before any government policies) are shaded. Government policies are shown in solid colours. Contributions to changes in disposable income pertaining to the price (income) side are shown in red (blue) tones. The dashed lines show the total effect on the income (price) side in blue (red). Equivalised disposable income is computed by dividing the household’s disposable income by its size on the OECD’s modified equivalence scale, which assigns a weight of one to the first adult of the household and a weight of 0.5 (0.3) to each additional household member over (under) 14.
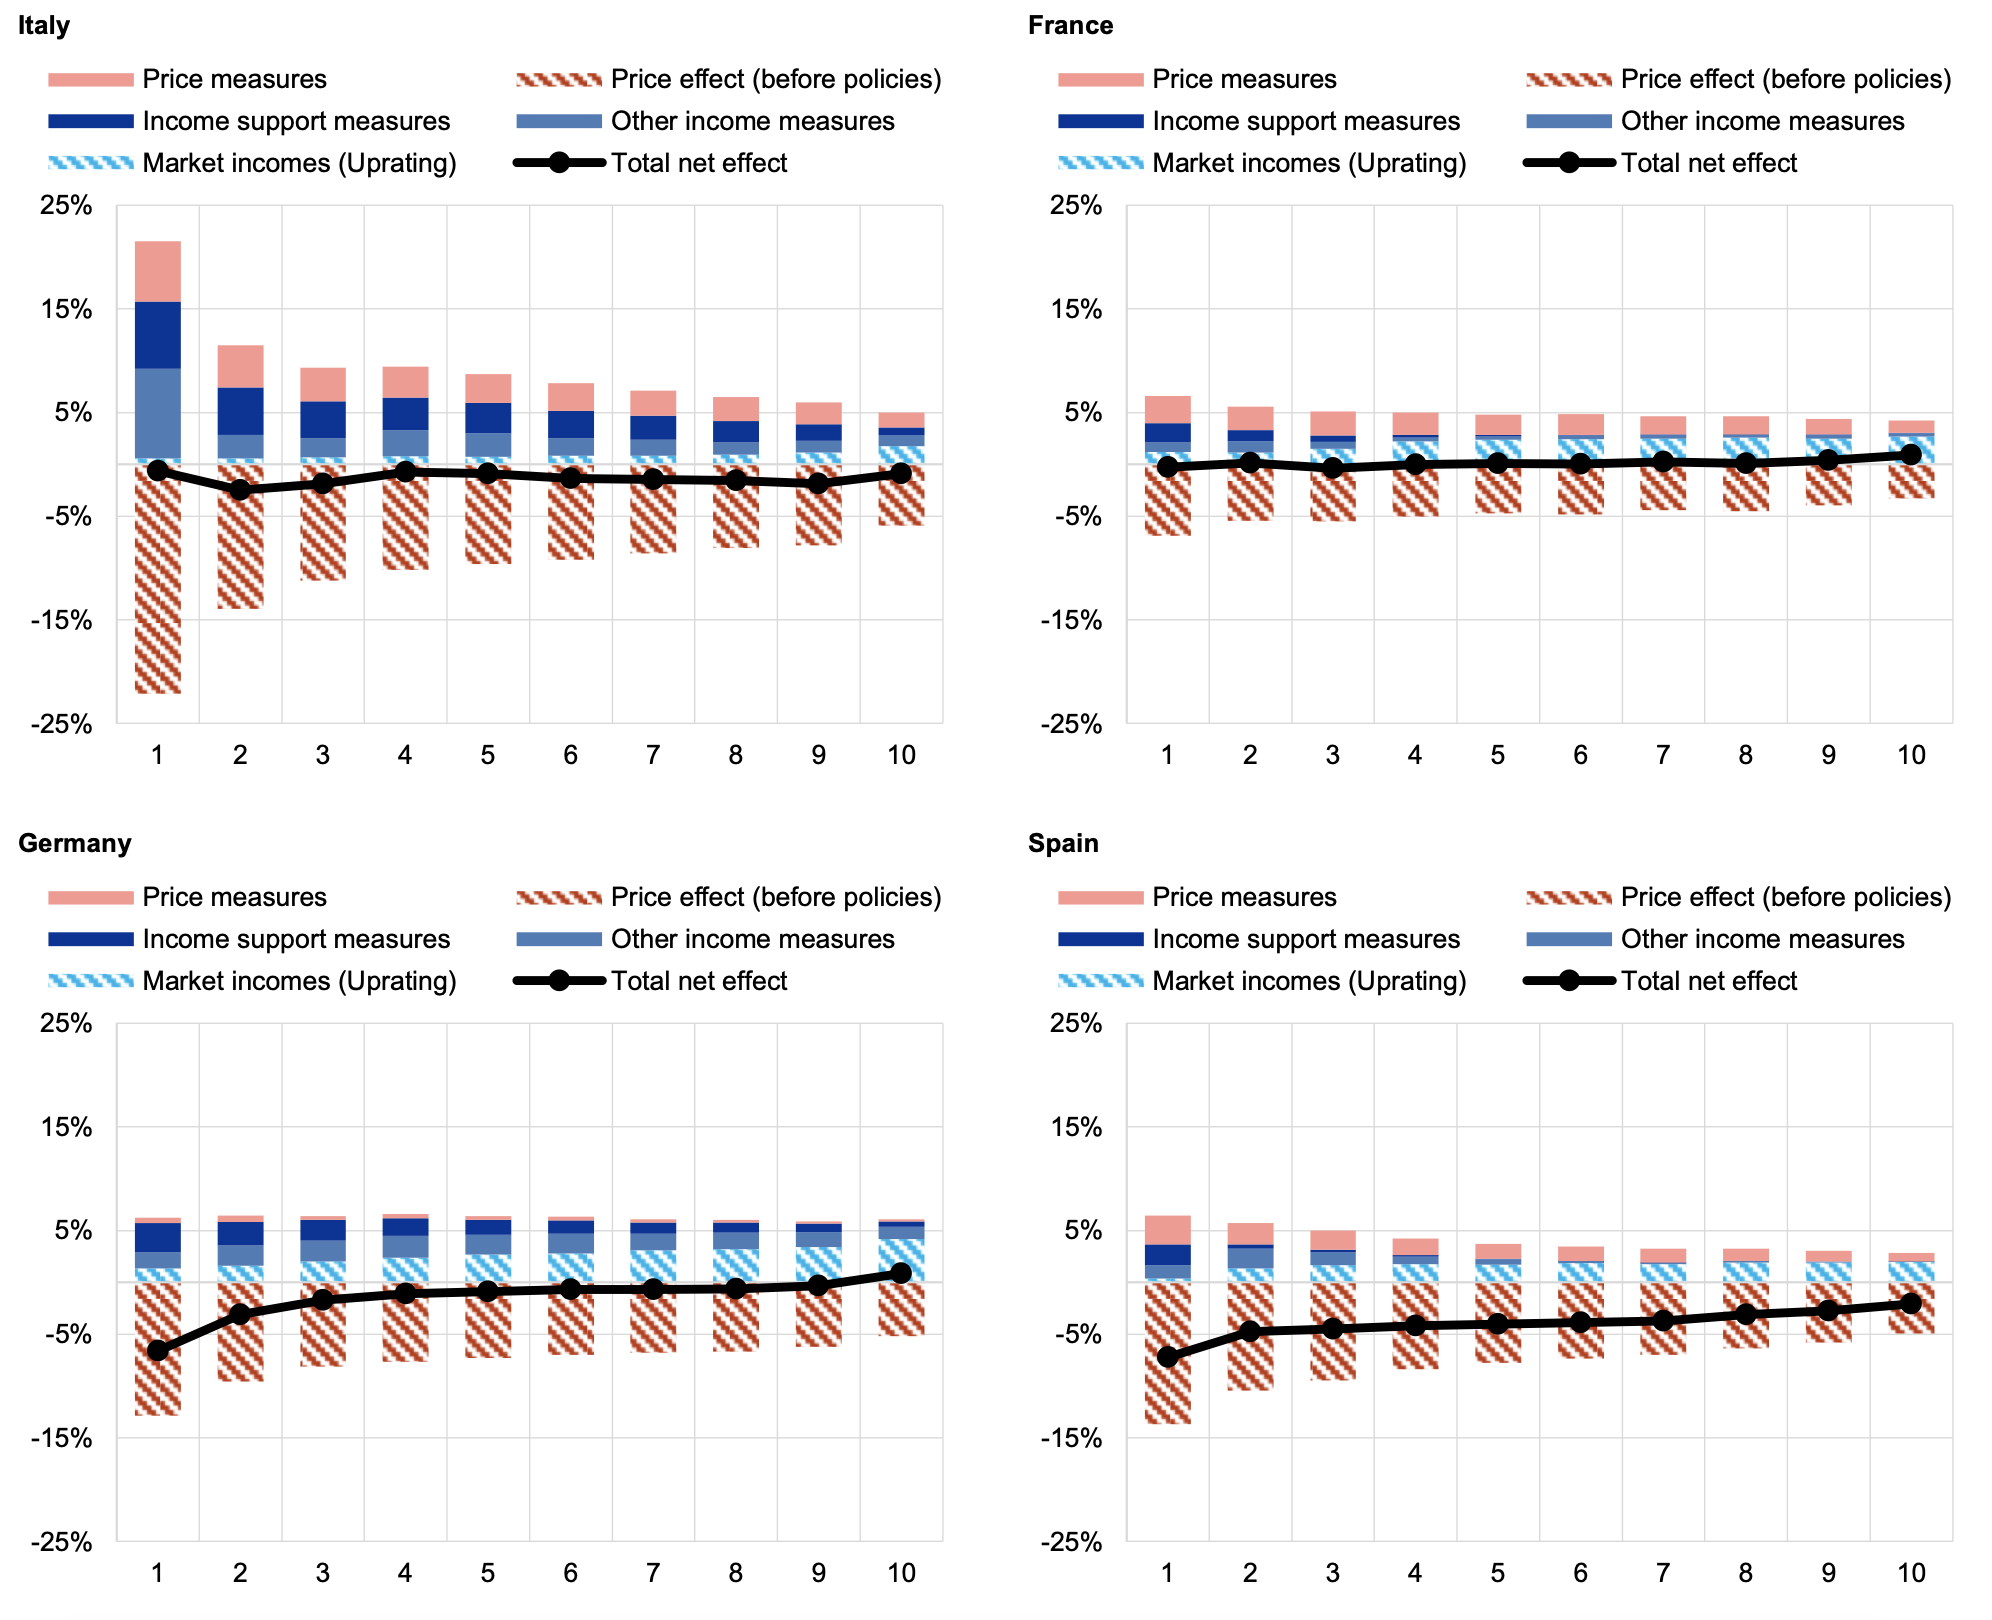
The effect of the government measures in offsetting the welfare loss caused by the inflationary surge has been even stronger in some euro area countries. In particular, according to EUROMOD simulations, they have helped to almost entirely offset the welfare loss across the distribution in France and Italy. In the case of France, the inflation shock was smaller, requiring a smaller effort than in Italy.
By contrast, households in other countries sustained a more significant average welfare loss, with low-income households being more severely affected. In Germany, the average household lost 0.7% in consumption welfare. The welfare disparity between the lowest and highest income decile increased by around 7.5 percentage points. In Spain, the average welfare loss amounted to 3.5% and the inequality gap between the lowest and highest income decile increased by more than 5 percentage points.
Figure 2 Price and income effects based on households’ welfare in the euro area countries (% change in equivalised disposable household income, per decile)
Source: Amores et al. (2023).
Notes: Market outcomes (before any government policies) are shaded. Government policies are shown in solid colours. Contributions to changes in disposable income pertaining to the price (income) side are shown in red (blue) tones. Equivalised disposable income is computed by dividing the household’s disposable income by its size on the OECD’s modified equivalence scale, which assigns a weight of one to the first adult of the household and a weight of 0.5 (0.3) to each additional household member over (under) 14.
The fiscal cost of inequality reduction
Both price and income measures contributed to reducing the rise in inequality on account of the consumer price inflation surge. However, the effectiveness of income measures in reducing inequality was higher. Price measures are far more difficult to target to vulnerable households.
As a result, the cost of closing the same inequality gap was much higher in countries that focussed on price measures than in countries that employed income measures. The cases of Greece and Portugal are illustrative. Government measures have contributed to cushioning the inequality effect of inflation in both countries by a similar margin.
However, Greece mainly employed price measures, while Portugal mainly employed income measures. EUROMOD estimates suggest that Greece spent around 2.5% of GDP on its fiscal measures, while Portugal achieved a similar effect with less than half the fiscal burden.
Authors’ note: The views expressed in this column are the sole responsibility of the authors and should not be attributed to the European Central Bank, the Eurosystem or the European Commission.
References
Acharya, S, E Challe and K Dogra (2023), “The science of monetary policy under household inequality”, VoxEU, 1 August.
Amores, A F, H S Basso, S Bischl, P De Agostini, S De Poli, E Dicarlo, M Flevotomou, M Freier, S Maier, E García-Miralles, M Pidkuyko, M Ricci, S Riscado (2023), “Inflation, fiscal policy and inequality: The distributional impact of fiscal measures to compensate consumer inflation”, ECB Occasional Paper.
Bańkowski, K, O Bouabdallah, C Checherita-Westphal, M Freier, P Jacquinot and P Muggenthaler (2023), "Fiscal policy and high inflation," ECB Economic Bulletin, Vol. 2.
Basso, H S, O Dimakou, and M Pidkuyko (2022), “How inflation varies across Spanish households”, ICE Revista de Economía 929: 85–103.
Bonfattia, A and E Giarda (2023), “Energy price increases and mitigation policies: Redistributive effects on Italian households,” CEFIN Working Papers No 92.
Charalampakis, E., Fagandini, B., Henkel, F. and Osbat, C. (2022), “The impact of the recent rise in inflation on lower-income households”, ECB Economic Bulletin, Issue 7.
Curci, N, M Savegnago, G Zevi and R Zizza (2023), “The redistributive effects of inflation: A microsimulation analysis for Italy”, VoxEU, 14 January.
Dao, M., P.O. Gourinchas and D. Leigh (2023), “Inflation and unconventional fiscal policy”, VoxEU, 30 Setember.
Menyhert, B. (2022), “The uneven effects of rising energy and consumer prices on poverty and social exclusion in the EU”, VoxEU, 13 December.
Sologon, D., O’Donoghue, C., Linden, J., Kyzyma, I., & Loughrey, J. (2023), “Welfare and Distributional Impact of Soaring Prices in Europe”, LISER Working Papers No. 2023-04.


