Appropriate indicators of housing valuation are important for macroprudential policy and assessments of risks to financial stability. Overvalued housing may result in a correction and a fall in house prices. This would weaken households’ balance sheets, reduce the collateral of mortgages and covered housing bonds, and could threaten financial stability.
According to European Systemic Risk Board (2022), Swedish owner-occupied housing (OOH) was overvalued by about 55% in 2021q2, the largest overvaluation in the EU and EEA; according to European Commission (2023), by about 30% in 2022. These assessments affect warnings and recommendations issued for Swedish economic policy and the shocks in EBA stress tests of Swedish banks.
But these large overvaluation assessments are due to the use of misleading indicators: the deviations of (house-)price-to-income (PTI) and price-to-rent (PTR) ratios from their historical averages. They disregard mortgage rates and other housing costs and lack scientific support. According to a large housing literature, it is not the purchase price but the user cost (UC) that is the appropriate measure of the cost of living in OOH, the cost of the housing services that the OOH delivers. It is the sum of real after-tax mortgage interest, cost of equity, operation and maintenance costs, taxes, depreciation, and any risk premium, less expected real capital gains.
Given this, the question, “Are house prices too high?”, is the wrong question. The right question is, “Are user costs too high?”
The general idea is to use affordability of OOH as a reverse indicator of overvaluation. In simple terms, “If it is relatively inexpensive to live in OOH, then the housing is not overvalued, and house prices are not too high.” As explained below, user costs will be calculated exclusive of capital gains (the ‘conservative assumption’). “If it is relatively inexpensive to live in OOH, even when any capital gains are excluded, then the housing is not overvalued,” and “If it is relatively expensive, even without any capital gains, then the housing may be overvalued.” Excluding capital gains means excluding the case that estimated user costs can be low because of overoptimistic capital gains, which would be typical of a hot market.
“Relatively” needs to be specified. It can be relative to rents, relative to income, relative to a particular year, or relative to a historical average. Because of Sweden’s dysfunctional rental market, with rent control and decade-long queues for apartments in the major cities, making rent-owning arbitrage very difficult, comparing to rents is less useful in Sweden.
In Svensson (2024), I construct new improved estimates of the user costs, including an adjustment for a preference shift during the coronavirus crisis in favour of larger and better housing. According to the user-cost-to-income (UCTI) ratio, Swedish owner-occupied houses have since 2010 instead become increasingly undervalued (not overvalued), by about 35% in 2019q4. Due to higher mortgage rates, they are less undervalued in 2023q4, but still about 25%.
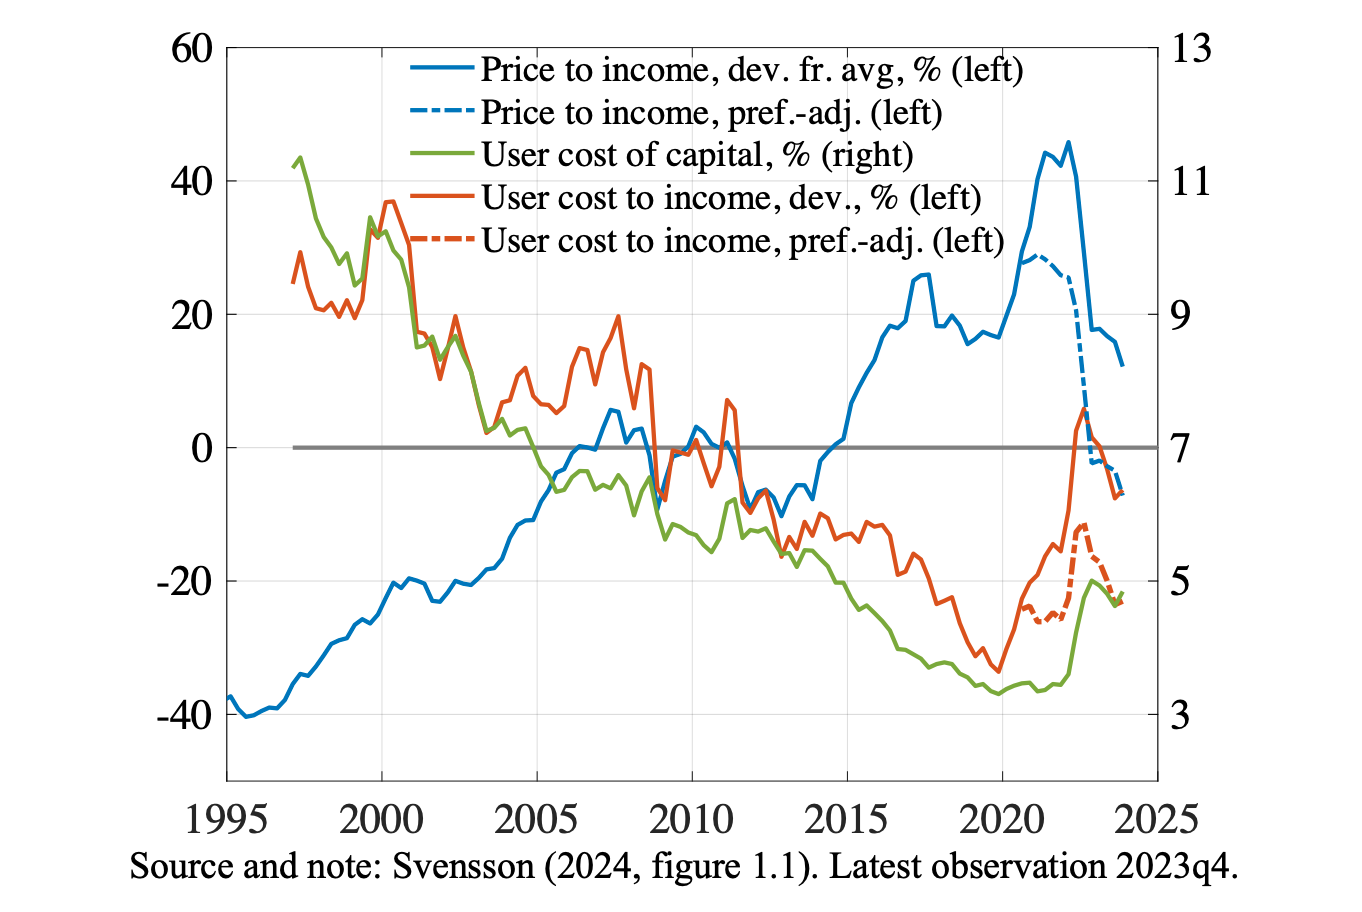
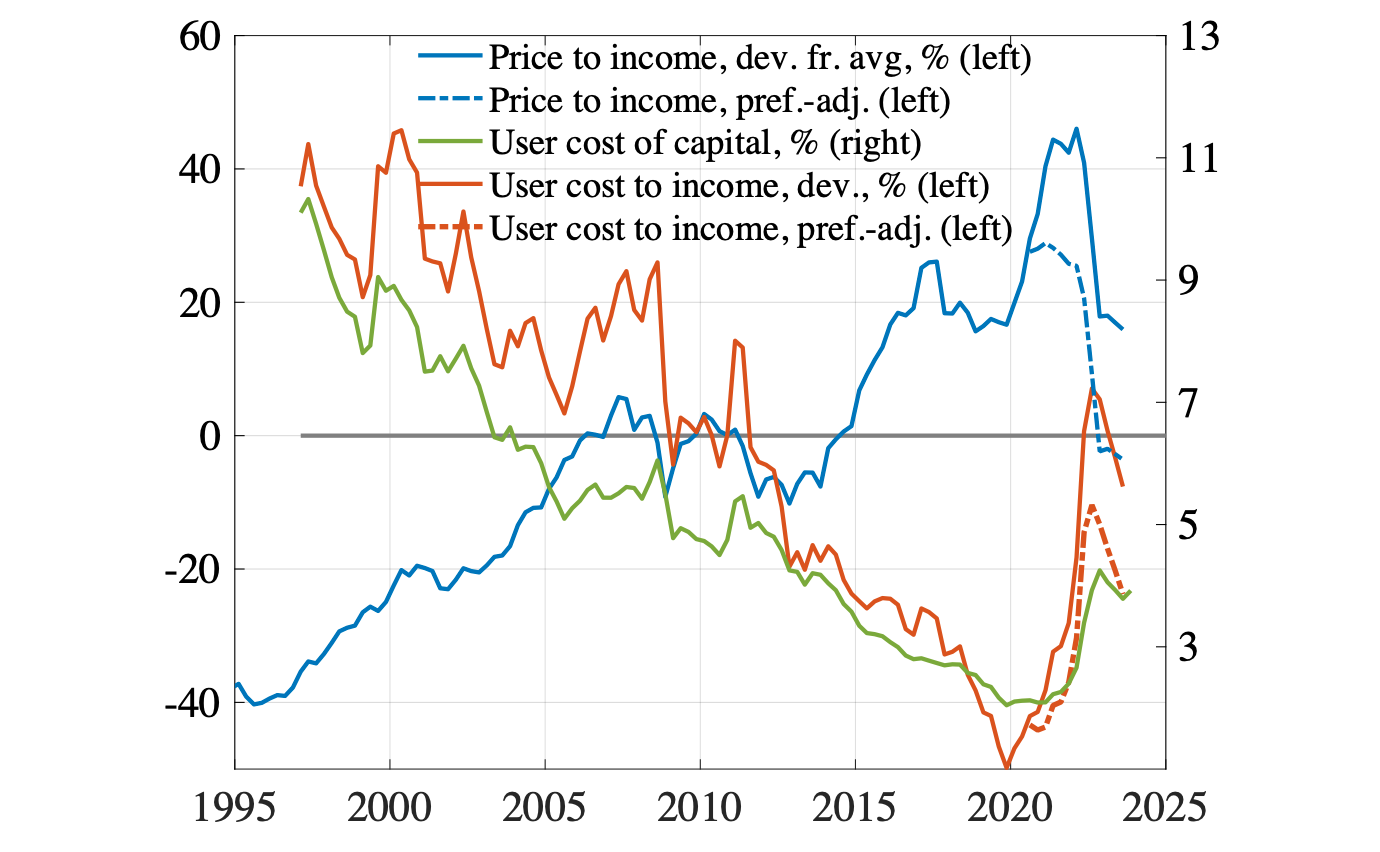
Figure 1 Price-to-income and user-cost-to-income ratios (percentage deviation from historical averages) and the user cost of capital (percent)
Source and note: Svensson (2024, figure 1.1). Latest observation 2023q4.
Figure 1 shows the main result. The solid blue line shows the percentage deviation of the PTI ratio from its historical average. According to it, Swedish houses were more than 40% overvalued in 2022.
The green line shows the user cost of capital (UCC) in percent. It is the user cost as a percentage of the house price. It falls to trough 2019–2021 and then rises due to higher mortgage rates.
The UCTI ratio is the product of the UCC and the PTI ration. The red line shows its percentage deviation from its historical average. We see that it equals its average in 2010, falls to a trough in 2019q4 and then rises back toward its average. According to it, Swedish houses were undervalued by about 35% in 2019q4 and is still somewhat undervalued in 2023q4.
The ESRB and the Commission report percentage deviations from the historical average, so doing so here simplifies the comparison. However, Figure 1 shows that, because the deviations are approximately zero in 2010, the PTI and UCTI deviations after 2010 are also percentage changes relative to the levels in 2010. ‘Overvaluation’ can thus be seen relative to the levels in 2010.
Figure 1 shows that the PTI ratio rose particularly fast during the coronavirus crisis 2020–2021. It did so in several comparable countries. This is generally interpreted as due to a fundamental preference shift toward larger and better homes, due to widespread working from home (Sveriges Riksbank 2021). The dash-dotted blue and red lines show corresponding preference-adjusted PTI and UCTI ratios. According to the latter, houses were still undervalued by about 25% in 2023q4.
For Sweden and this sample, the PTI and UCTI ratios are negatively correlated, with a correlation coefficient equal to –0.8. This means that the UCTI and PTI ratios give opposite valuation indications. If the UCTI indicator is the right valuation indicator, the PTI indicator is the wrong one.
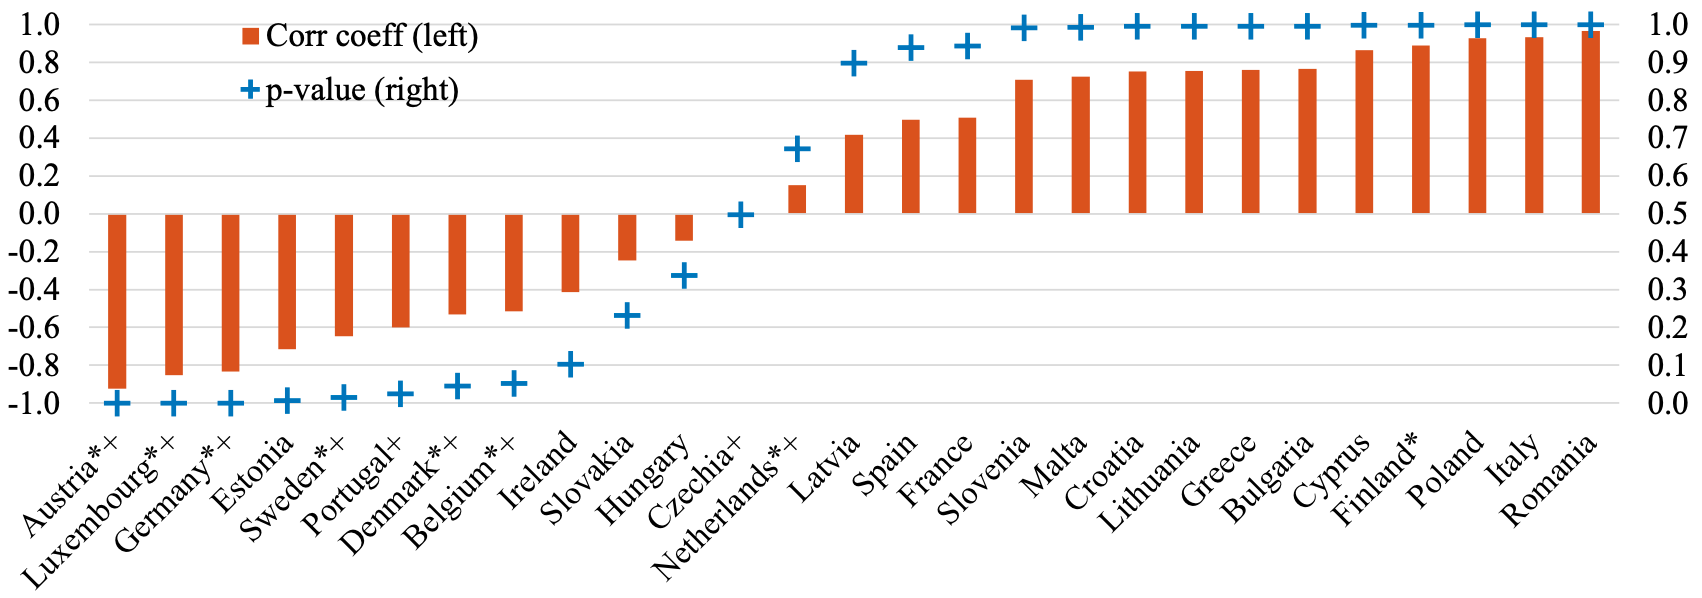
Figure 2 Correlation coefficients for PTI and UCTI ratios for EU countries 2010–2020 and p-values for a negative coefficient
Source and note: Own preliminary calculations, based on Barrios et al. (2019) and Grünberger et al. (2023). * denotes the countries that received recommendations by ESRB. + denotes countries for which OOH was considered more than 20% overvalued by the European Commission.
The negative correlation is not obvious. If the UCC is relatively flat, the correlation becomes positive. Figure 2 shows that the correlation is negative for several EU countries, but not for all. The problem of misleading indicators and overvaluation assessments – and resulting distorted warnings and recommendations – is not restricted to Sweden but concerns several other countries in the European Union.
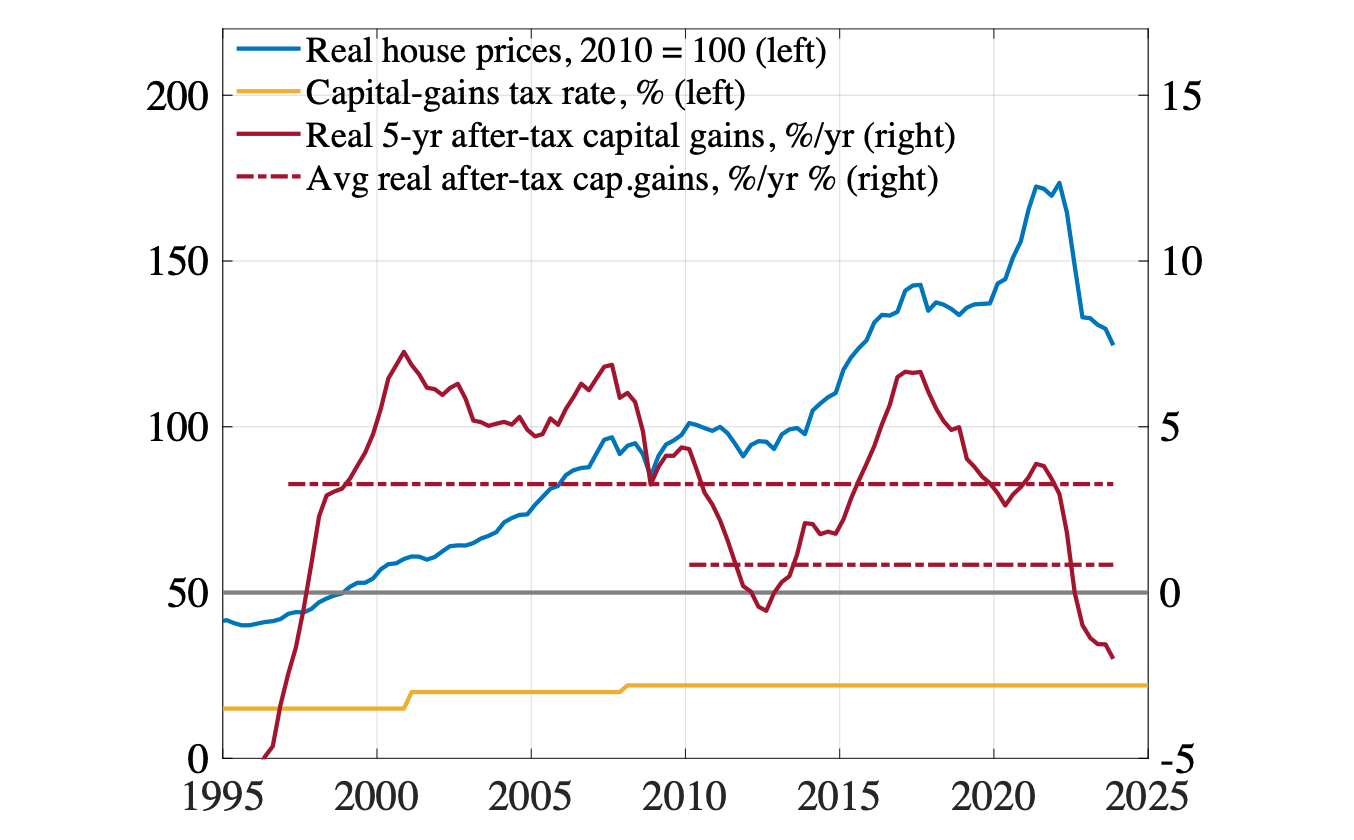
Figure 3 Real house prices, actual real 5-year after-tax capital-gains rates, and averages rates from 1997q1 and 2010q1 to 2023q4
Source and note: Svensson (2024, figure D.2).
Expected real (after-tax) capital gains reduce the UC and enter with a negative sign. Unfortunately, there are no regular time-series data on Swedish households’ expectations of future house-price appreciation. Actual real capital gains are substantial and volatile. Figure 3 shows actual real (after-tax) 5-year capital gains at an annual rate. It also shows the average annual rate of capital gains from 1997q1 and 2010q1 to 2023q4, 3.3% and 0.8%, respectively.
Given this, I choose to set the expected real 5-year capital gains equal to their approximate lower bound, which in this case is zero. I call this the ‘conservative assumption’ because it underestimates actual capital gains. Under the assumption that expected capital gains exceed the lower bound and are positive, it implies an upper bound on the UC and the UCTI. This in turn implies a bias in favour of finding overvaluation. Because I reject overvaluation after 2010, this bias is good, a feature rather than a bug, and implies that the rejection is stronger.
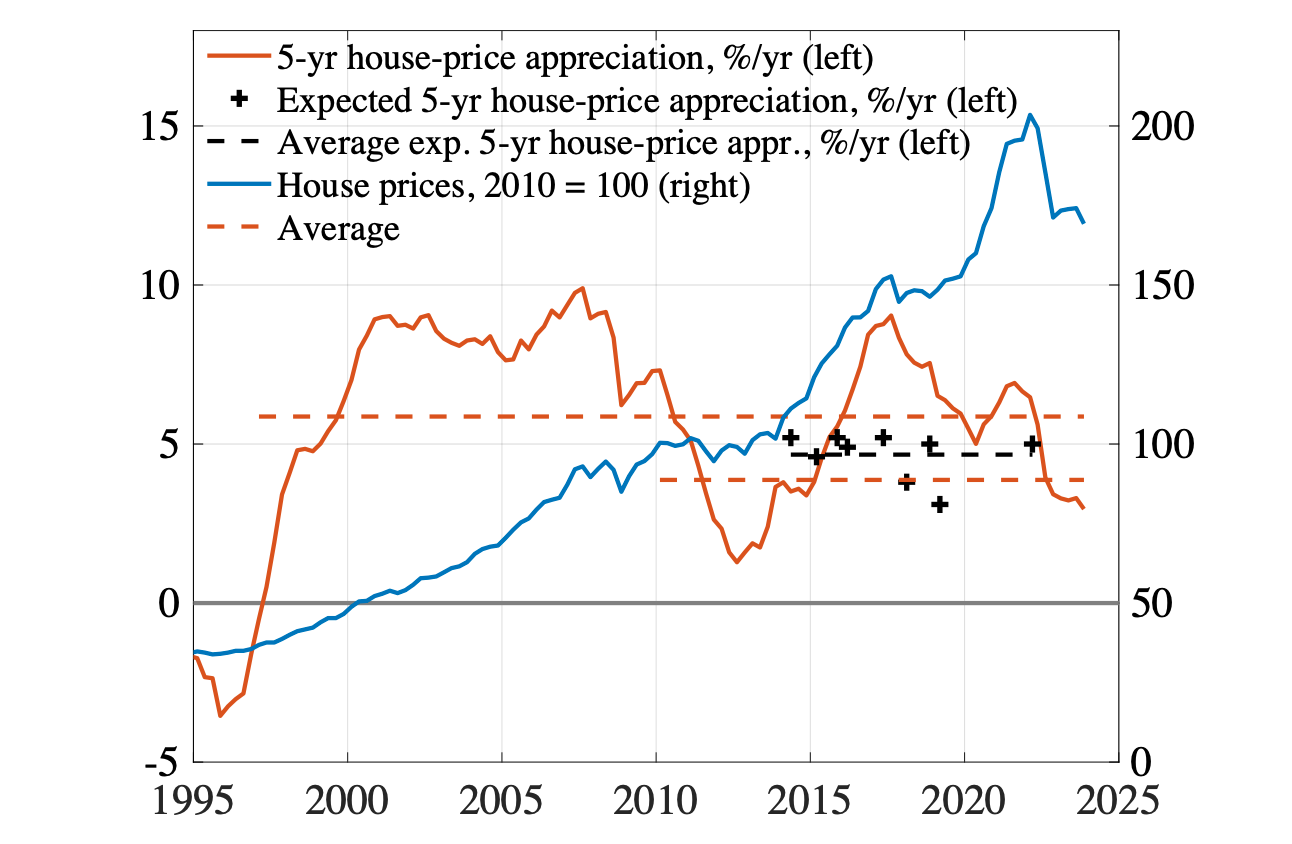
Figure 4 Actual and expected 5-year nominal house-price appreciation, actual house prices, and the average rates of nominal house-price appreciation from 1997q1 and 2010q1 to 2023q4
Source and note: Svensson (2024, figure 3.2). Expectations of households active in the housing market of the major cities.
Even if we exclude expected capital gains from the UC, it is of independent interest whether households have realistic or overoptimistic capital-gains expectations. There are actually a few data points from June 2014 to March 2022 of households’ 5-year house-price expectations from June 2014 to March 2022, from surveys by Evidens (2019, 2022).
They are shown in figure 4. They are quite stable with a maximum of 5.2% and a mean of 4.7% They are realistic and not overoptimistic. There is no sign of expectations being extrapolative expectations. The peak of actual house-price appreciation of 9% in 2017 does not seem to affect the expectations at the same time.
Figure 5 Price-to-income and user-cost-to-income ratios (percentage deviation from historical averages) and the user cost of capital (percent). 4% expected 5-year nominal capital gains
Source and note: Svensson (2024, figure F.18).
Does the conservative assumption imply a bias toward overvaluation (less undervalution)? Figure 5 shows the result under the assumption of expected capital gains of 4%, slightly less than the mean in figure 4. Such expectations lower the UCC and shifts the green line down by about 1 percentage point compared to Figure 1.
This in turn makes the red UCTI line steeper and indicating that houses were undervalued by more than 40% in 2019q4. The undervaluation in 2023q4 is also larger than in figure 1. In this case, the conservative assumption implies a bias toward less undervaluation after 2010.
What about any overoptimism about future mortgage rate? For that issue, there is excellent data on households’ 1-, 2-, and 5-year mortgage-rate expectations. (I wish we had the same data on house-price expectations.)
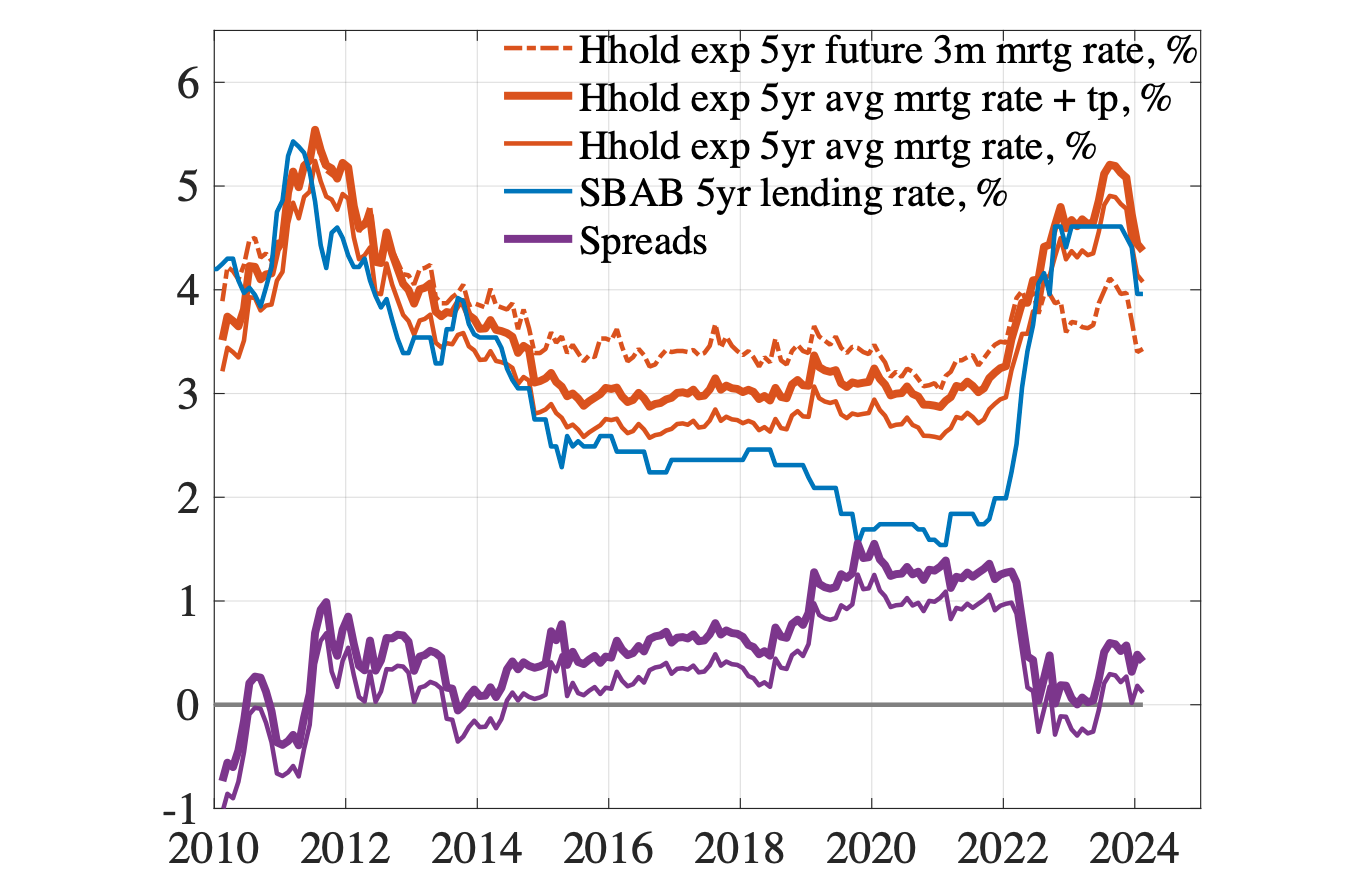
Figure 6 Swedish households’ expected 5-year average of future 3-month mortgage rates with and without term premium, the SBAB 5-year lending rate, and spreads, 2010–January 2024
Source and note: Svensson (2024, figure 3.1). Term premium 30bp.
In Figure 6, the blue line shows a 5-year mortgage rate of the bank SBAB. The thin red line shows households’ expectations of the average 3-month mortgage rate over the next 5 years. The thick red line shows this with an added term premium, to make it comparable to the 5-year mortgage rate. As we see, households expect substantially higher average 3-month rates than SBAB rate, expect around 2023. Overall, there is no indication that households have overoptimistic expectations of future low mortgage rate.
If there is a well-functioning rental market and rent-owning-arbitrage is possible, the UCTR ratio is a most useful independent indicator of valuation. Because of Sweden’s dysfunctional rental market, with rent control and decade-long queues for apartments in the major cities, it is less useful in Sweden.
The Swedish housing and mortgage market are very different from those of the US. The US experience is hardly relevant for Sweden. There is full regress, so there are no strategic defaults. There is no buy-to-let and no investors. Swedes buy to live, rather than speculate in capital gains. The average length of living in the same house is about 33 years. Mortgages stay on the balance sheet of the lenders, so lenders internalise the risk of the loans. Lending standards are high; in affordability tests, borrowers are typically required to be able to manage stressed interest rates of 6–7%. Non-performing mortgages are extremely rare.
The user-cost approach used here is not a theory of house-price determination, of how house prices depend on fundamental determinants. The user cost is calculated for given house prices and other relevant variables. It has the advantage that it can be used very granular analysis of locations and type of dwelling down to the unit level, as demonstrated by Flam (2016), on apartments in the Stockholm city centre, and Svensson (2020), on studios (1-room apartments) in Stockholm Municipality and County, respectively. It is very flexible. The assumptions are transparent and can be adapted to the situation in focus.
There are several papers with different models of house-price determination that discuss possible overvaluation in Sweden, with different definitions of overvaluation. Most do not find any overvaluation, a few find some overvaluation. They are discussed in Svensson (2024, section 1.7).
I see no problem but an advantage with have several indicators and models of overvaluation. Ideally, they should be ranked according to their reliability and useability.
References
Case, K E, and R J Shiller (2003), “Is There a Bubble in the Housing Market?” Brookings Papers on Economic Activity 2: 299–362,
European Systemic Risk Board (2022), Vulnerabilities in the Residential Real Estate Sectors of the EEA Countries, February.
European Commission (2023), “In-Depth Review for Sweden,” Commission Staff Working Document SWD(2023) 644 final, 24 May.
Evidens (2019), “Hushållens långsiktiga förväntningar på bostadsprisutvecklingen [Households’ Longer-Term Expectations about Housing Prices],” presentation, February, Evidensgruppen.
Evidens (2022), “Hushållens förväntningar på bostadsmarknaden—bostadsmarknaden vid en brytpunkt? [Households’ Expectations about the Housing Market—the Housing Market at a Breakpoint?],” presentation, May, Evidensgruppen.
Flam, H (2016), “Har vi en bostadsbubbla? [Do We Have a Housing Bubble?],” Ekonomisk Debatt 44(4): 6–15,
Grünberger, K, A Mazzon, and I. J Tudó Ramírez (2023), “Housing Taxation Database 1995–2021, v. 4.1,” dataset, European Commission Joint Research Centre.
Svensson, L E O (2024), “Are Swedish House Prices Too High? Why the Price-to-Income Ratio is a Misleading Indicator,” working paper, Stockholm School of Economics.
Svensson, L E O (2020), “Macroprudential Policy and Household Debt: What is Wrong with Swedish Macroprudential Policy?”, Nordic Economic Policy Review 2020: 111–167 (includes online appendix).
Sveriges Riksbank (2021), “Rapidly Rising Housing Prices despite the Corona Virus,” Monetary Policy Report April 2021, Box 2, pp 67–77.
Thiemann, A, K Grünberger, and B Palma Fernández (2022), “Housing Tax- ation Database 1995–2020, v. 3.0,” dataset, European Commission Joint Research Centre (JRC).

