Social scientists have shown a lot of interest in historical demography in recent times, with extensive research on pandemic shocks such as the Spanish flu and on the timing and causes of the demographic transition as a source of economic growth (Cervellati-Sunde 2012) and a key component of unified growth theory. However, the empirical testing so far has relied on data from a small and possibly not representative sample of advanced countries. The first estimate of world population dates back to 1661, but the most commonly used databases, such as McEvedy-Jones (1978) and Maddison (1995), report yearly series only for a handful of mostly advanced countries and a few scattered benchmark estimates for the world total. The League of Nations started to publish comprehensive country series in 1925, but they were suspended at the outbreak of the war and resumed in 1950 by the United Nations (United Nations 2019).
Our research project fills this gap (Giovanni and Tena-Junguito 2022). We estimate a yearly series of the total population for all polities (colonies and independent countries) from 1800 to 1938. To do so, we rely on the obscure but highly praiseworthy work of historical demographers, who painstakingly collected, assessed, and (when necessary) corrected official data and any available information. We fill gaps with interpolations and extrapolate backwards the population from the earliest available figure to 1800 or forward from the latest one to 1938. We also take into account the population movements in neighbouring or otherwise comparable polities and also the available information on demographic crises (most notably, the Spanish flu). The country data refer to the present (de facto) population, when possible, adjusted to mid-year. They all include natives, as their omission would bias upwards the growth of population, and refer to current borders – so that some series cover only part of the period (e.g. Austria-Hungary stops in 1918; Czechoslovakia, Hungary, and Poland start in 1919). Overall, the database features 174 series for a total of 21,815 country-year observations. Needless to say, our figures are of widely different quality, ranging from the almost perfect for Scandinavian countries to mere guesswork for sub-Saharian Africa and Oceania in the early 19th century. We assess the reliability of each observation, following Durand (1977), by grading it from ‘A’ (excellent) to ‘E’ (conjecture), with a margin of error ranging from 2.5% (± 1.25% around the ‘true’ value) to over 40% for Es (with a band ±25%). Assuming plausibly that errors in series are independent, we compute the world aggregate error as the sum of variance of polity series. This declines from 18.7% to 12.4% of total population, but about a half of this change is accounted for by the spectacular improvement in the series for Oceania, a consequence of the collapse of the poorly counted native population.
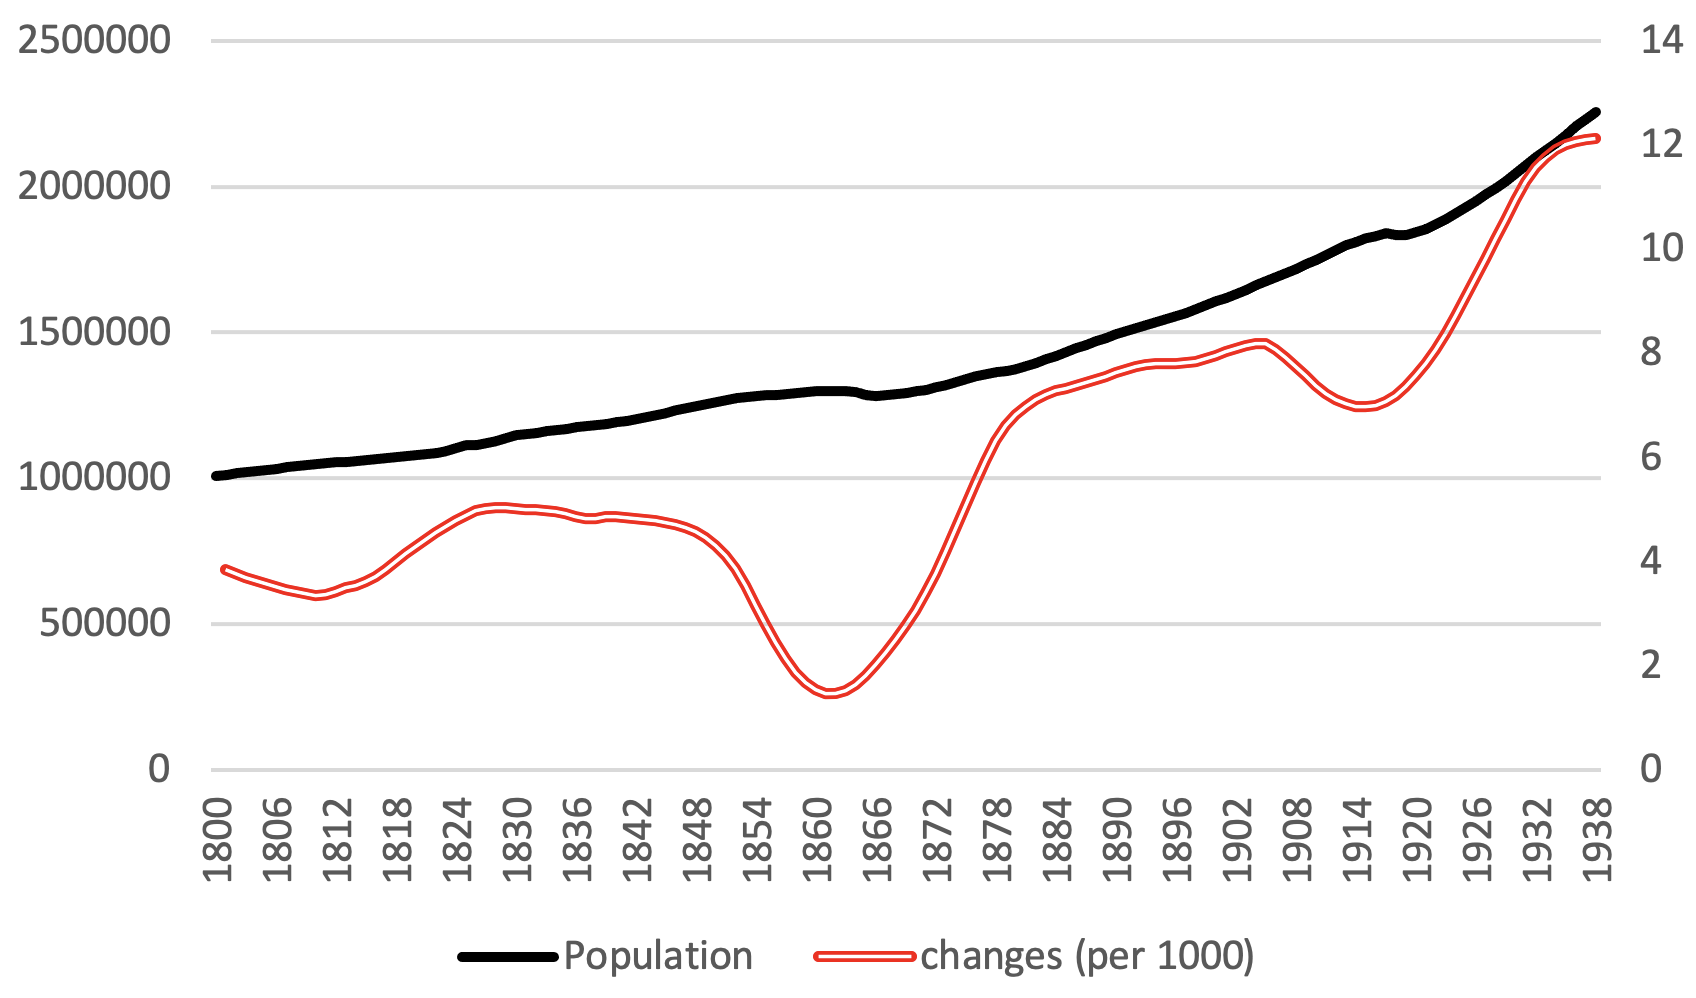
In our baseline estimate, the world population grew by 123%, from just above 1 billion in 1800 to 2.2 billion, which corresponds to a log rate of 5.4‰ (i.e. 5.4 parts per thousand). Even in the worst case, errors are unlikely to alter the basic narrative. The maximum (minimum) increase – i.e. the difference between the lower (upper) bound of the range in 1800 and the upper (lower) bound in 1938 – is 159.5% (94.1%). A visual inspection (Figure 1, left axis) suggests an almost linear increase, but yearly changes, even when smoothed with an Epanechnikov kernel (Figure 1, right axis), tell a somewhat different story. Growth accelerated from about 4‰ in the early 1800s to around 12-13‰ on the eve of WWII (for comparative purposes, the peak growth rate was 20‰ in 1965-1970 and it was 11‰ in 2015-2020). The upward trend was interrupted by two massive crises: one in the mid-19th century, when China was hit by a devastating civil war between the imperial government and the Tai’ping; and one in the second half of the 1910s due to the combined effect of WWI, the Spanish flu, and the Russian famine and civil war.
Figure 1 World population and its yearly change, 1800-1938
Source: Federico and Tena-Junguito (2022).
The increase in world population is not a novel result; the differences with the benchmark estimates by Maddison are modest. The real valued added of the database are the yearly series, which make possible a much more fine-grained analysis than the crude continent-based benchmarks so far available before 1925. Population growth was very unequally distributed in the world and, as clear from Figure 1, was far from smooth.
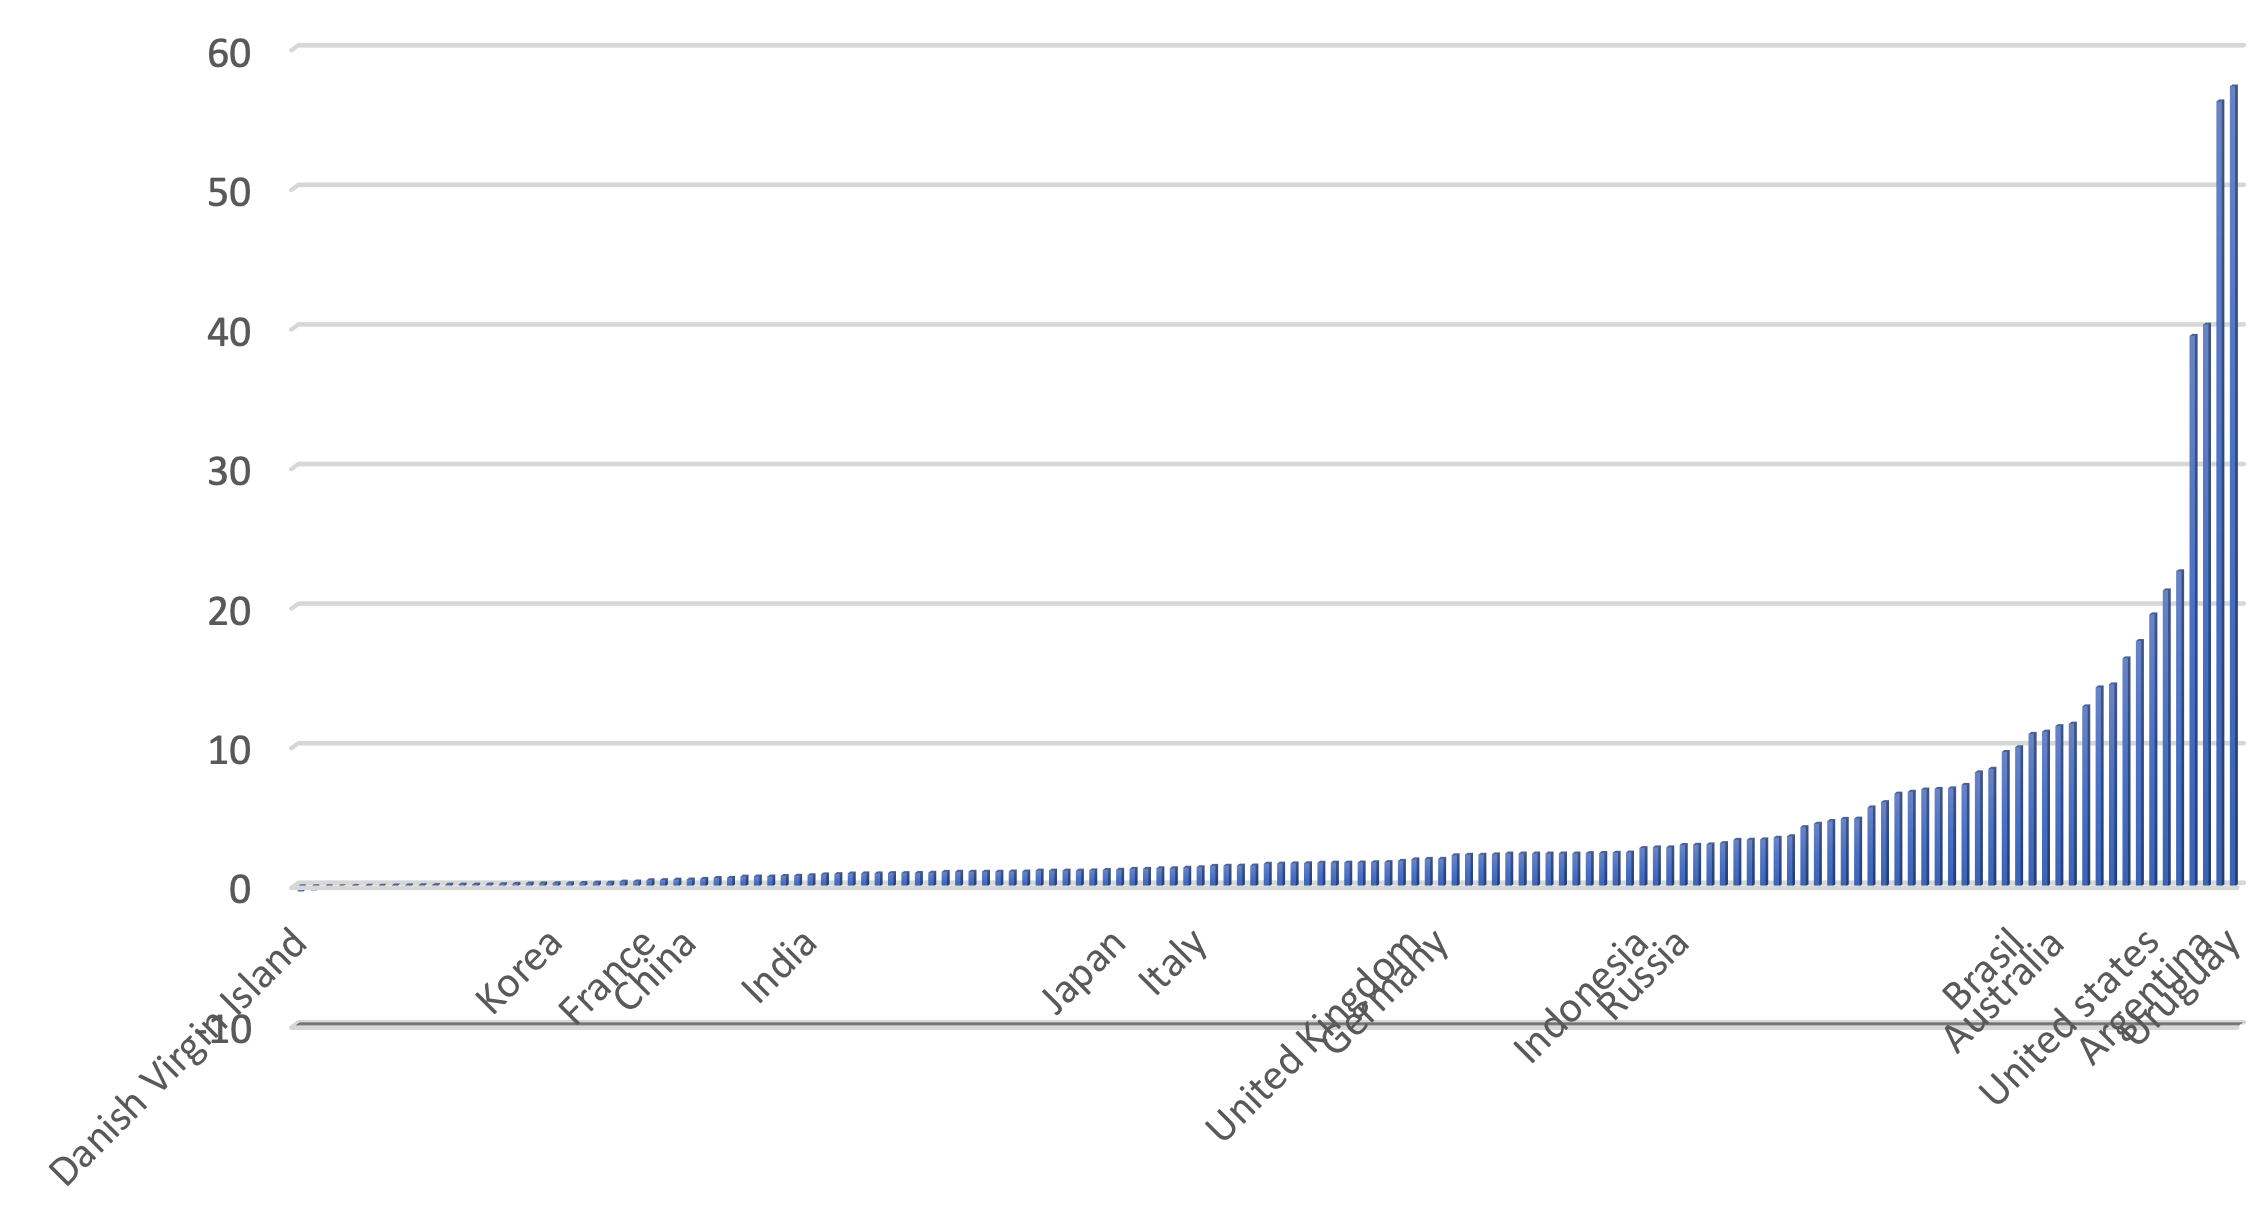
In the long run, total population grew in almost all polities (with three very minor exceptions) but, as Figure 2 shows, the increase differed a lot, ranging from near stagnation (less than 50% over the whole period – i.e. 0.37% per year) in many African countries (and France and China) to over ten times in most immigration countries, including the US.
Figure 2 Population growth by polity, 1800-1804 to 1934-1938
Source: Federico and Tena-Junguito (2022).
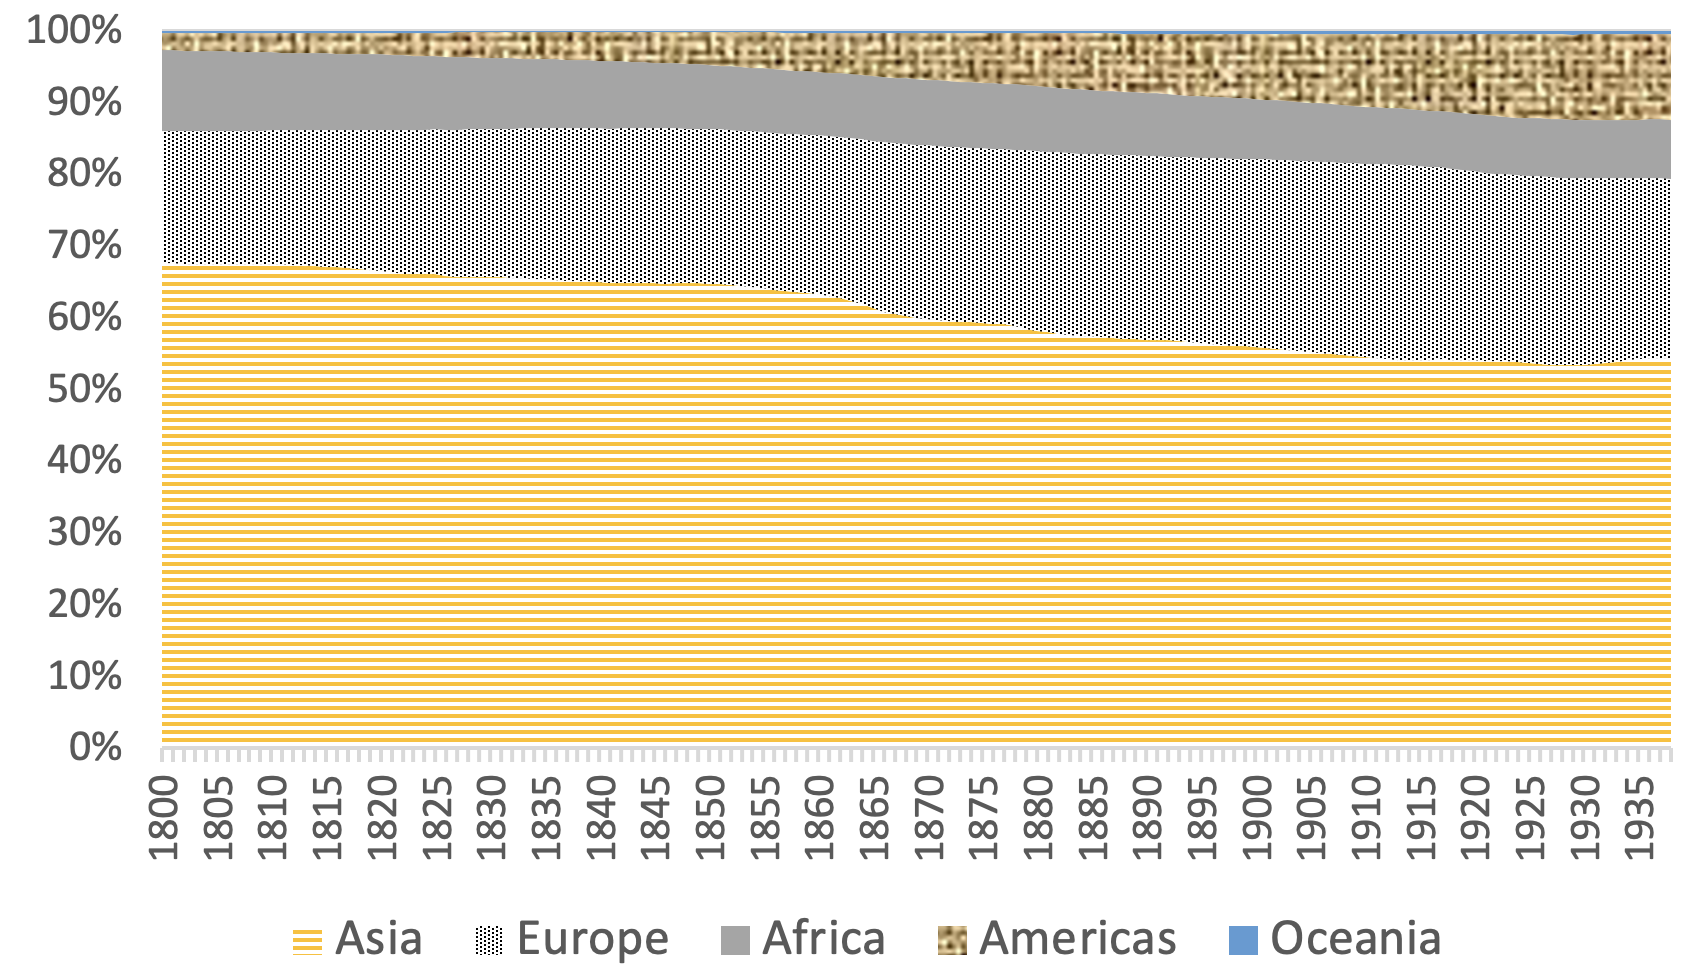
The time patterns also differed quite markedly: growth started in Europe and possibly in the Americas (with a great contribution from immigration) in the 17th-18th century, and started to grow quickly or accelerated in the rest of the world in the 19th century. These different patterns changed the distribution of world population by continent (Figure 3) substantially.
Figure 3 The distribution of world population by continent, 1800-1938
Source: Federico and Tena-Junguito (2022).
The relative population declined in Africa and Asia, increased in Europe (here including the whole of Russia), and boomed in the Americas and Oceania. The changes were massive by 1870, but were mostly over by the eve of WWI. Indeed, trends slowed down or even reversed in the interwar years, and total changes were small in comparison with pre-war ones. Africa’s share of the world population fell by a fifth in the first half of the 19th century (from 11.3% to 8.9%), slid by a further percentage point to 7.8% in 1913, and by 1938 was roughly at the level of the mid-1900s. The Asian share declined over the whole period by 13 points (from 67% to 55%), with a third of this change taking place in the 1850s and 1860s. Likewise, two-thirds of the relative rise of Europe from 18% in 1800 to 27% in 1913 took place before 1870. The European share fell during the war by one point and continued to decline afterwards. The American share rose rapidly from 2.5% in 1800 to 10.4% in 1913, and then more slowly to 11.9% of the world population by the eve of WWI. However, continents are arguably not the right level of geographical aggregation, as the distribution by areas within continents shows substantial variation, especially due to the effect of migration. Migration boosted the share of Australia and New Zealand from one-quarter to three-quarters of the total for Oceania, and the share of North America from 26% to 52% of the total for the Americas. Other changes within continents were less dramatic, but still relevant: Eastern Europe increased from a fifth to a third of the European continent, and China decreased from 54% in the 1840s to 45% in the 1870s of the total for Asia.
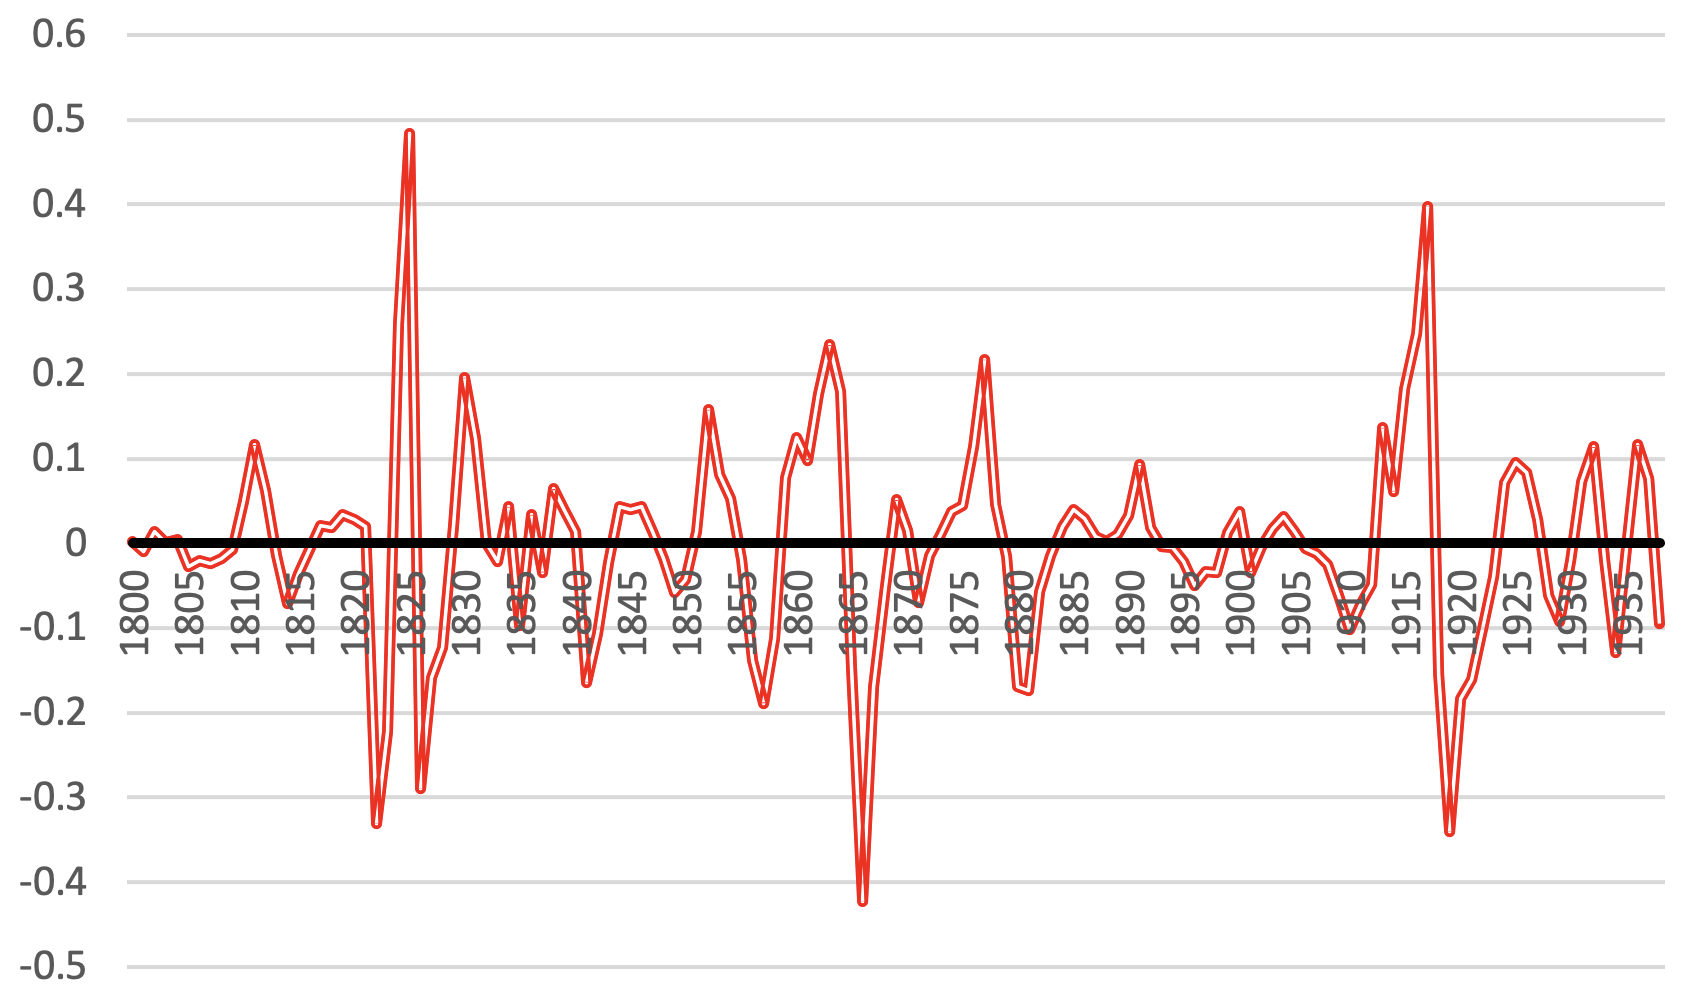
While the smoothed series of rates of change in Figure 1 is always positive, the world population actually decreased in six years (1826, 1863-1866 and 1918). It decreased at least once in two-thirds of the polities (121 out of 174), for about a sixth of the observations (3,324 country-years out of 21,641), and remained constant in other 811 cases. In a minority of cases, the population fell sharply due to famines or epidemics: the Spanish flu claimed about 35-40 million lives worldwide in 1918 and caused the population to decrease in 48 out of 158 polities. The Tai’ping war reduced the Chinese population from about 440 million in 1852 to about 360 million in 1871 – a demographic catastrophe only comparable to WWII in the last two centuries. But most crisis observations belong to long-term downward population trends in three areas – the Pacific islands, the Caribbean, and sub-Saharian Africa in the first half of the 19th century – which were hit by (European) diseases and by the slave trade. As a consequence of crises, the volatility of world population, as measured by residuals from a Hodrick-Prescott filtered series, did not decline significantly (Figure 4).
Figure 4 Volatility of population, 1800-1938
Source: elaborations from Federico and Tena-Junguito (2022).
There is also no statistical evidence of a decline in volatility for specific geographic areas, except in Western and Southern Europe before 1913. Furthermore, the average volatility over whole period was similar in the core countries (8.8%) and in the peripheral ones (8.5%).
Our results do not tally well with the standard model of demographic transition, which explains the population growth with a decrease in mortality caused by economic growth or by progress in medicine. We find that population growth all over the world began before the start of economic growth and the discovery of effective drugs. Furthermore, the stable volatility seems to contrast with the hypothesised reduction in the severity of mortality crises. If not by a decrease in mortality, population growth must be explained by an increase in fertility, which is not easy to explain in countries experiencing no economic growth. Our database raises some challenging questions for historical demography and thus also for the design of demographic policies.
References
Cervellati, M, and U Sunde (2011b), “Disease and Development: The Role of Life Expectancy Reconsidered”, Economics Letters 113(3):269-272.
Federico, G, and A Tena-Junguito (2022), “How many people on earth? World population 1800 1938”, Maddison project Working paper.
Maddison, A (1995), Monitoring the world economy, OECD Publishing.
McEvedy, C and R Jones (1978), Atlas of World Population History, Viking Penguin.
United Nations (2019), World Population Prospects: The 2019 Revision, Population Division Department of Economic and Social Affairs.

