Inflation rates in the UK and US are currently at their highest levels in over 30 years. In July 2022, annual Consumer Price Index (CPI) inflation in the UK was 10.1%, up from 2% in July 2021. Naturally, this rise in inflation has generated significant interest, in both academic and policy circles. Although the contribution of different factors for inflation varies across countries (Gagnon 2022), experts have emphasised the importance of shipping costs and supply disruptions (Carriere-Swallow et al. 2022, Eo et al. 2022, Vehbi et al. 2022), tight labour markets (Blanchard 2022), shifts in demand to goods from services (Fornaro and Romei 2022), and the Russia-Ukraine war (Beck et al. 2022). In a recent paper (Bunn et al. 2022), we use firm-level data from the Decision Maker Panel (DMP) to study inflation dynamics in the UK, and in particular since the start of the Covid-19 pandemic. The DMP is a representative monthly survey of chief executive officers and chief financial officers across the UK, with around 3,000 responses each month. It was established in 2016, and is run by the Bank of England in partnership with the University of Nottingham and Stanford University.
In this column, we establish four new findings based on our recent research. First, there has been an asymmetric effect of Covid-19 on inflation: positive demand shocks increased prices at the firm level by more than negative demand shocks lowered them. Second, this asymmetric response helps explain why inflation decreased only modestly during the first year of the pandemic, despite the dramatic fall in demand. Third, we document that along with higher inflation, there has been a significant increase in inflation dispersion and (positive) skewness across firms over the last 18 months. Both higher dispersion and positive skewness are strongly positively correlated with firm-level price growth. Finally, we show that within-firm inflation uncertainty has also increased significantly over the past year, even as sales uncertainty declined.
Demand shocks and price inflation
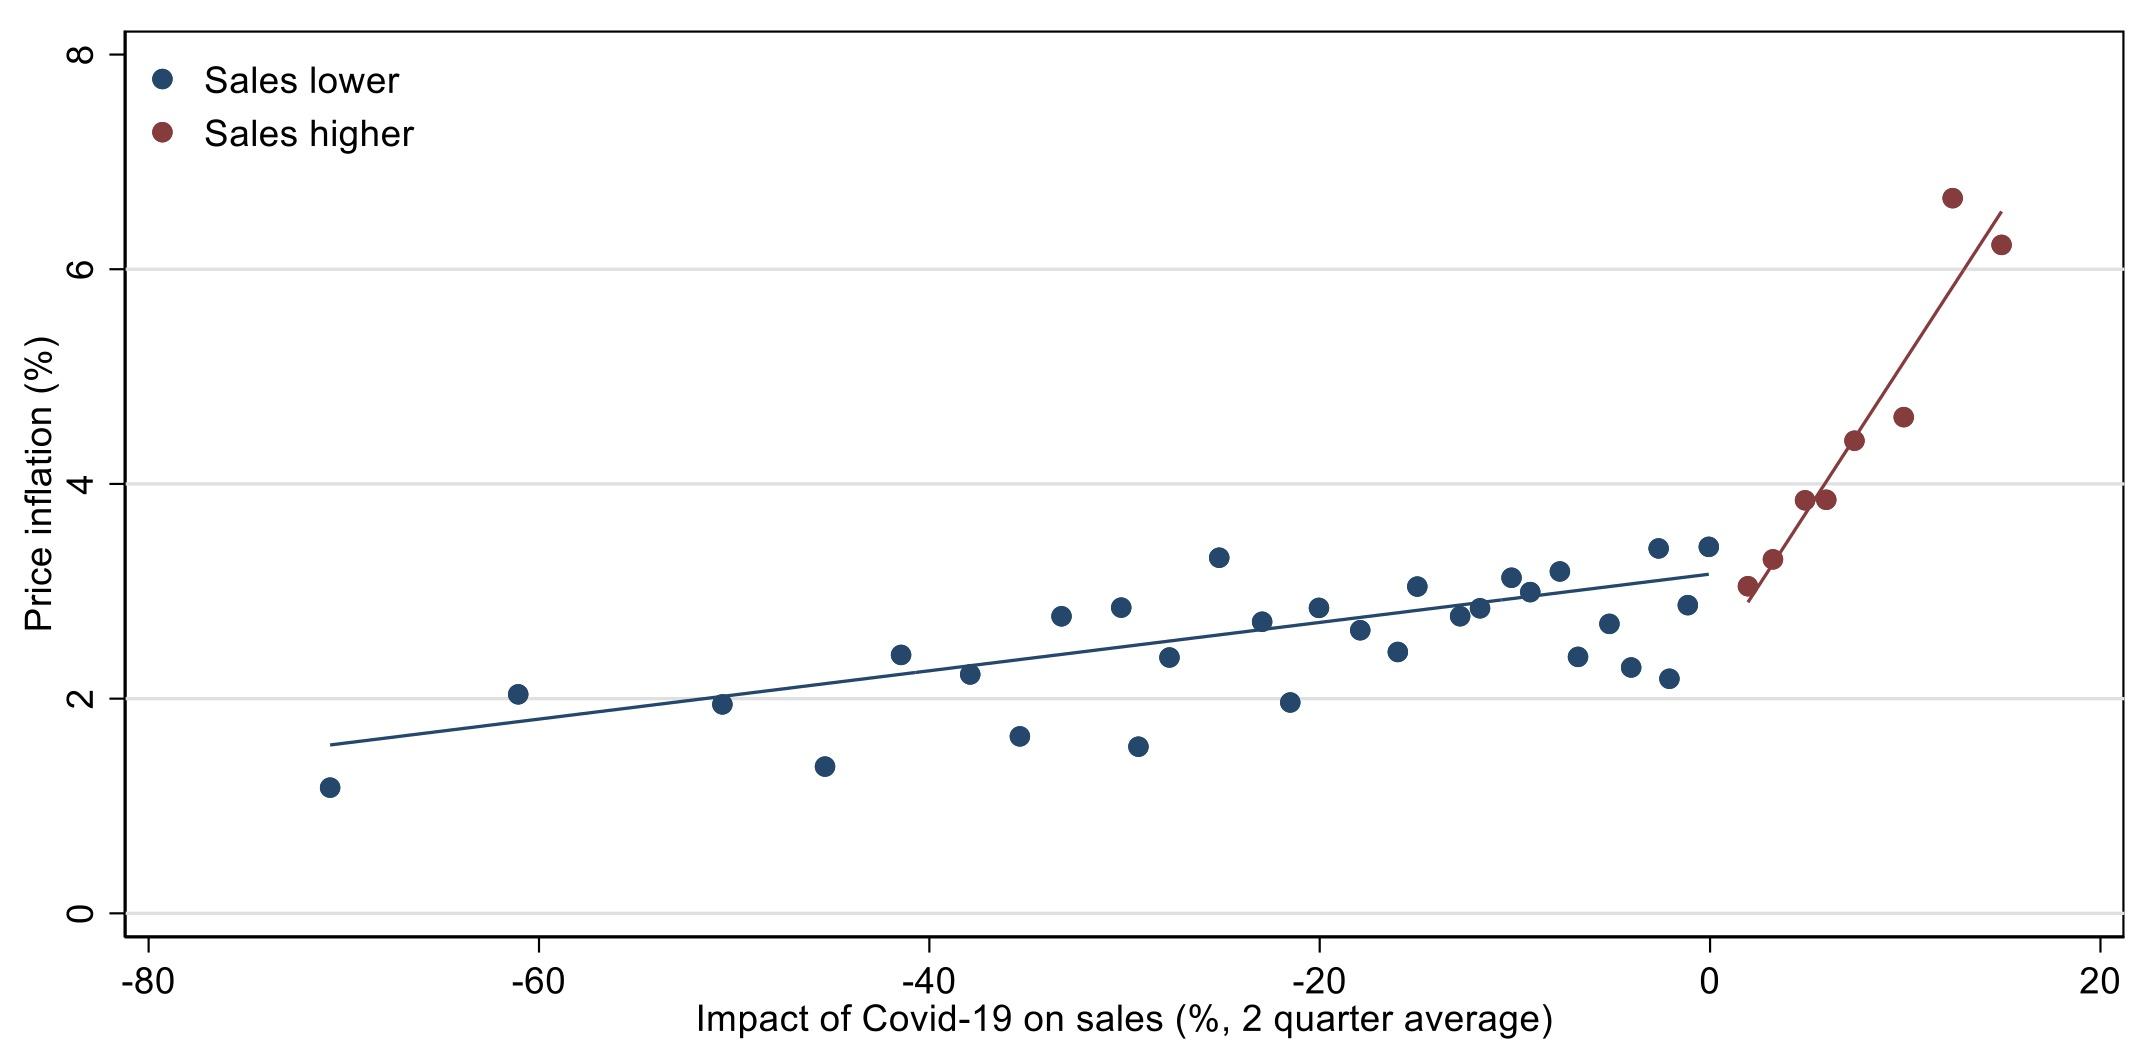
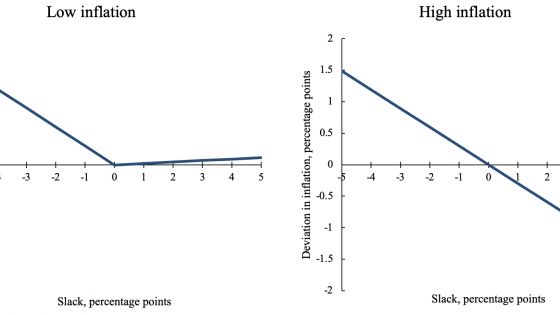
The pandemic has been an unprecedented shock for UK businesses. Starting in April 2020, firms in the DMP have been asked to estimate how Covid-19 has affected their sales, relative to what would have otherwise happened. On average, between 2020 Q2 and 2022 Q2, 64% of firms responded that Covid-19 had lowered their sales, 19% reported no impact, and 16% reported a positive impact. Figure 1 shows that firms set their prices asymmetrically depending on whether they experienced a positive or negative shock. Businesses facing a positive shock increased their prices by much more than businesses facing a negative shock lowered them. This non-linear firm-level ‘Phillips curve’ is consistent with recent cross-country evidence in Forbes et al. (2021a, 2021b) and helps explain why inflation did not fall by more in the first year of the pandemic, which we discuss next.
Figure 1 Realised inflation and the impact of Covid-19 on sales
Notes: This figure presents the relationship between the impact of Covid-19 on sales and price inflation using data from the DMP. Each dot represents 2% of observations (during the pandemic, 2020 Q2 to 2022 Q2), grouped by impact of Covid-19 on sales. Zero responses are excluded.
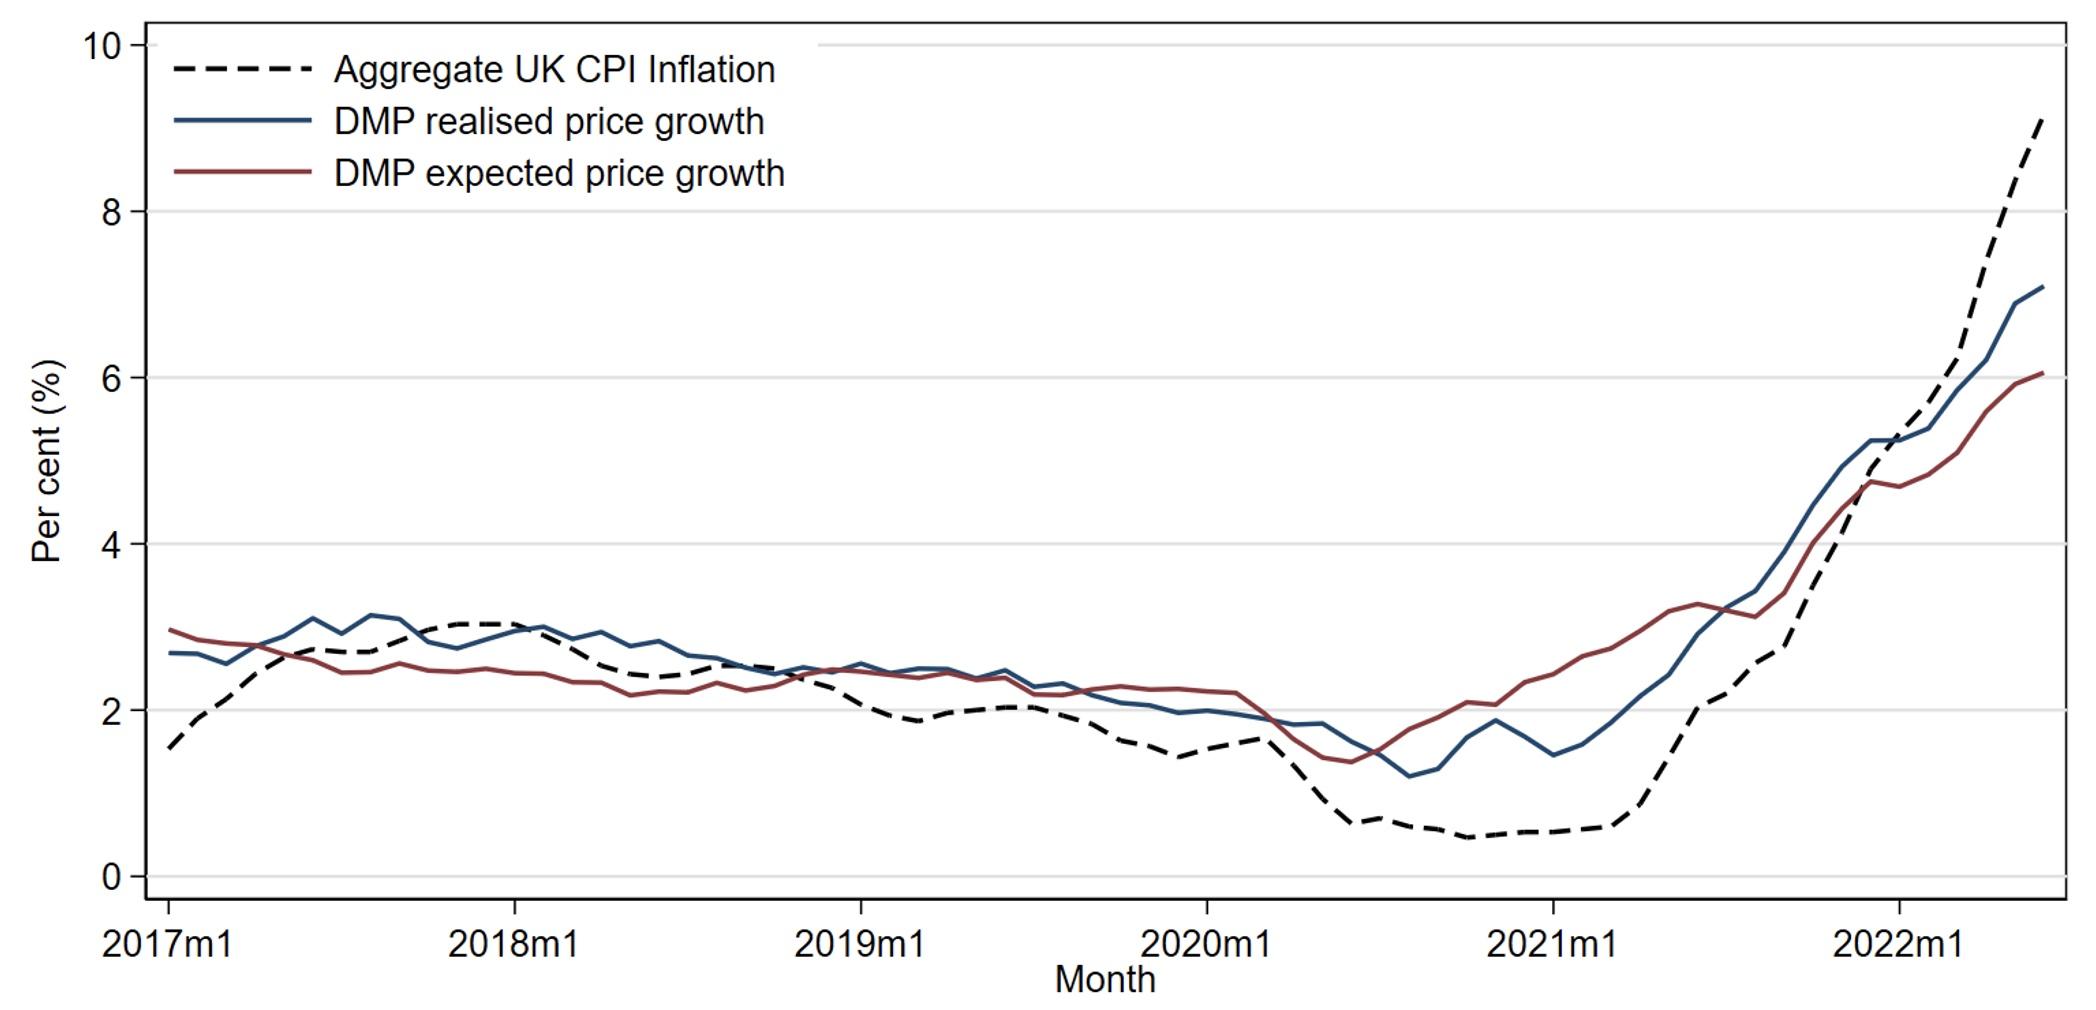
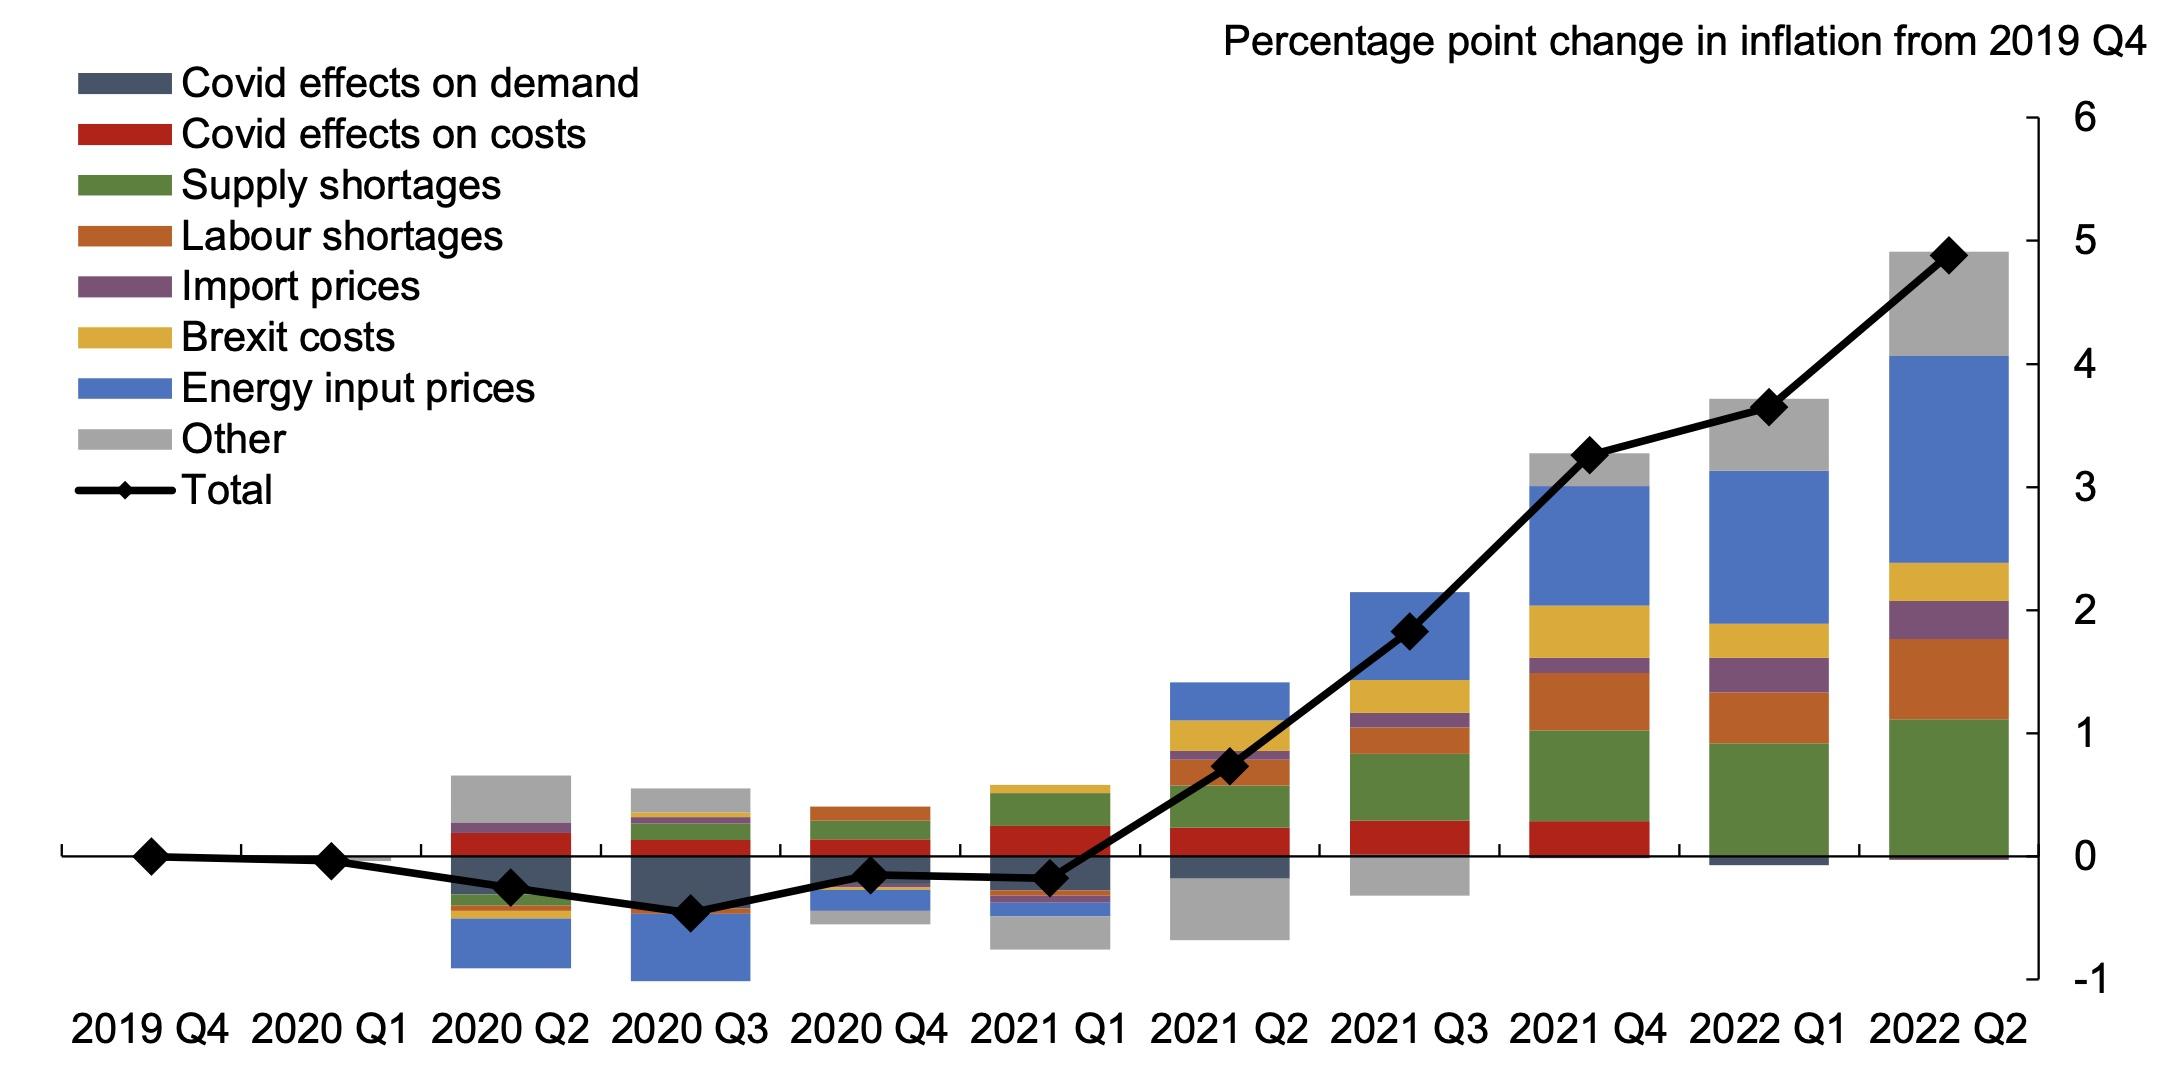
Inflation rates have gone through two phases since the start of the pandemic. DMP inflation data capture prices from firms across the economy, but they closely track aggregate consumer price data (Figure 2, Panel A). In the first year of the pandemic, firm price growth declined; the DMP measure reached a trough of 1.2% in August 2020. However, since the second quarter of 2021, it has quickly increased above pre-pandemic rates, and stood at 7.1% in 2022 Q2. Figure 2, Panel B provides a decomposition of the changes in realised inflation in the DMP since the fourth quarter of 2019. The asymmetric response to the Covid-19 shock presented in Figure 1 helps explain why, despite the large fall in demand, there was only a small fall in price growth relative to trend. The dark blue bars represent the effects of Covid-19 on demand. However, the Covid-19 demand shock explains almost none of the rise in inflation since the start of 2021. One reason is that only a small portion of firms experienced a positive demand shock from Covid-19, and therefore not enough to make an aggregate contribution. In addition, over the past year new factors have emerged as key drivers of inflation dynamics.
The main factors estimated to have been driving price inflation in recent quarters are energy input prices, supply shortages, and, to a lesser extent, labour shortages. We proxy the impact of energy input prices using Office for National Statistics (ONS) input-output tables on energy costs at the industry level. In the second quarter of 2022, energy input prices contributed 1.7 percentage points to the increase in inflation above trend. Wholesale energy prices have increased significantly over the past year, due to multiple factors, including the war in Ukraine (World Bank 2022). The large energy contribution is consistent with firms across the economy already having raised prices because they are passing on increases in their own energy costs.
The contribution of supply and labour shortages, meanwhile, is estimated using direct questions asked in the survey. We estimate that supply and labour shortages contributed 1.1 percentage points and 0.7 percentage points, respectively, to inflation in the second quarter of 2022.
Figure 2 Annual firm price growth
Panel A) Realised and expected firm price growth
Panel B) Contributions to changes in realised inflation since 2019 Q4
Notes: Panel A presents the evolution of realised price growth over the past 12 months, expected price growth over the year ahead using data from the DMP, and aggregate UK CPI inflation. All three series are three-month moving averages. Panel B presents a decomposition of changes in realised inflation since 2019 Q4 based on a regression framework. See Bunn et al. (2022) for more details.
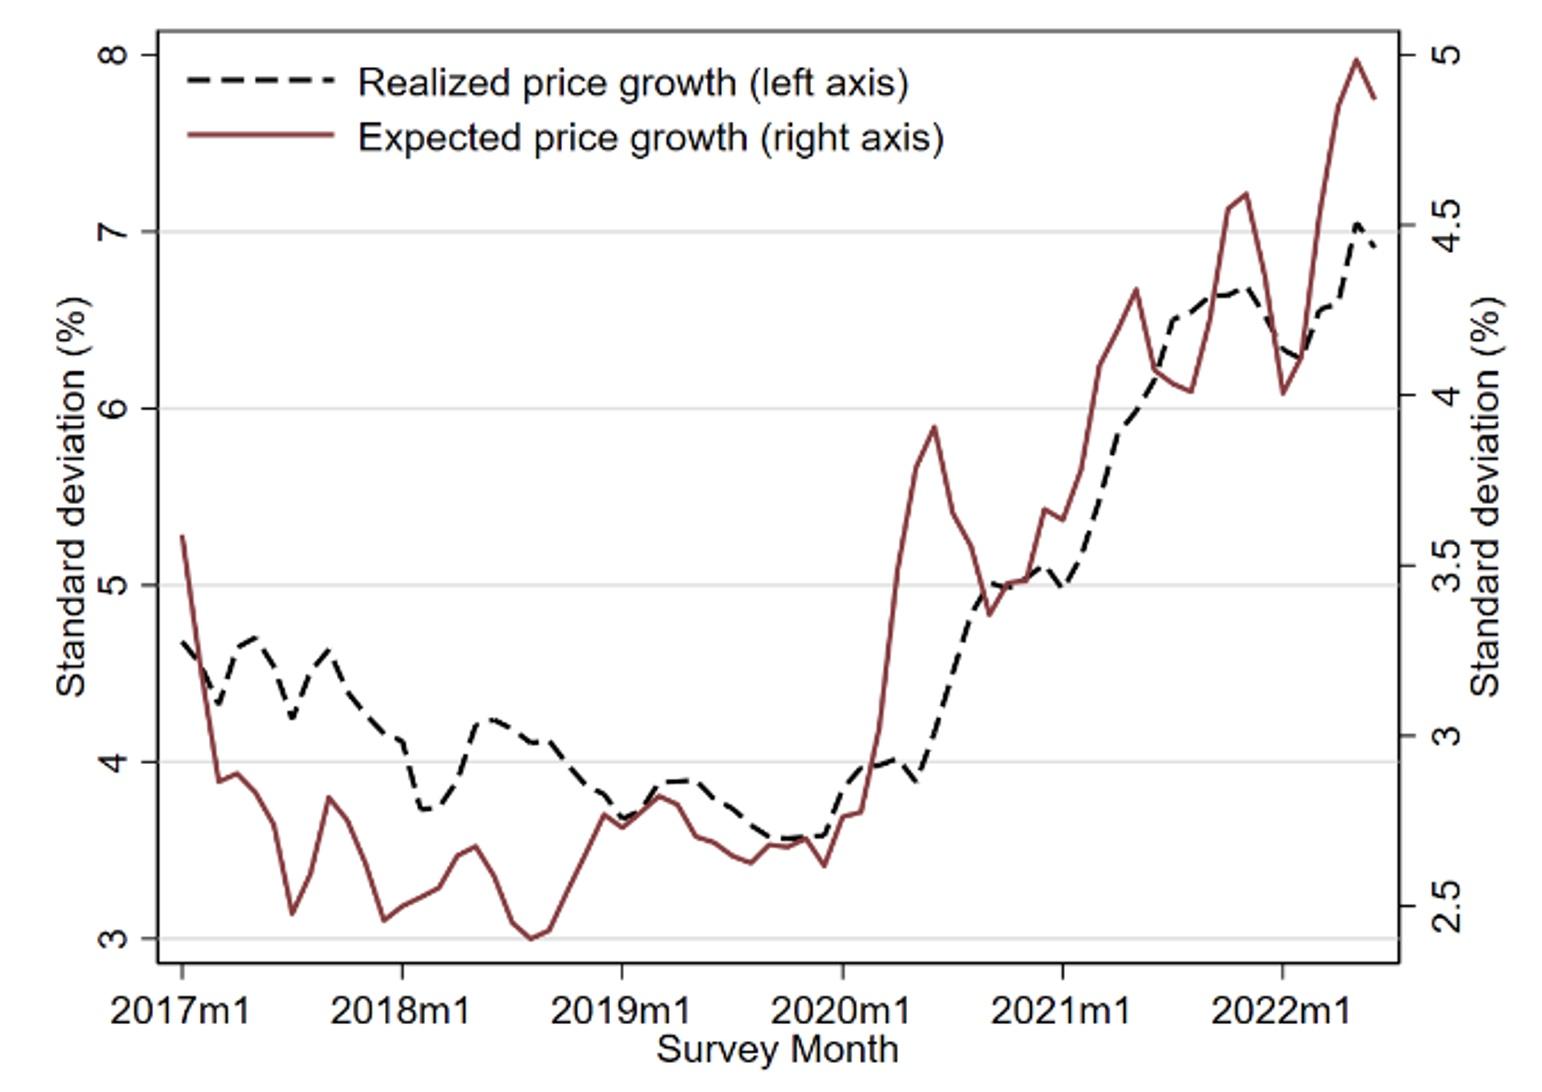
Beyond the trends in average price growth, we document large changes in the dispersion and skewness of inflation across firms over the past two years. Figure 3, Panel A shows the evolution of inflation dispersion for both realised and expected price growth; the standard deviation of prices has increased from below 4% in 2019 to nearly 7% in 2022.
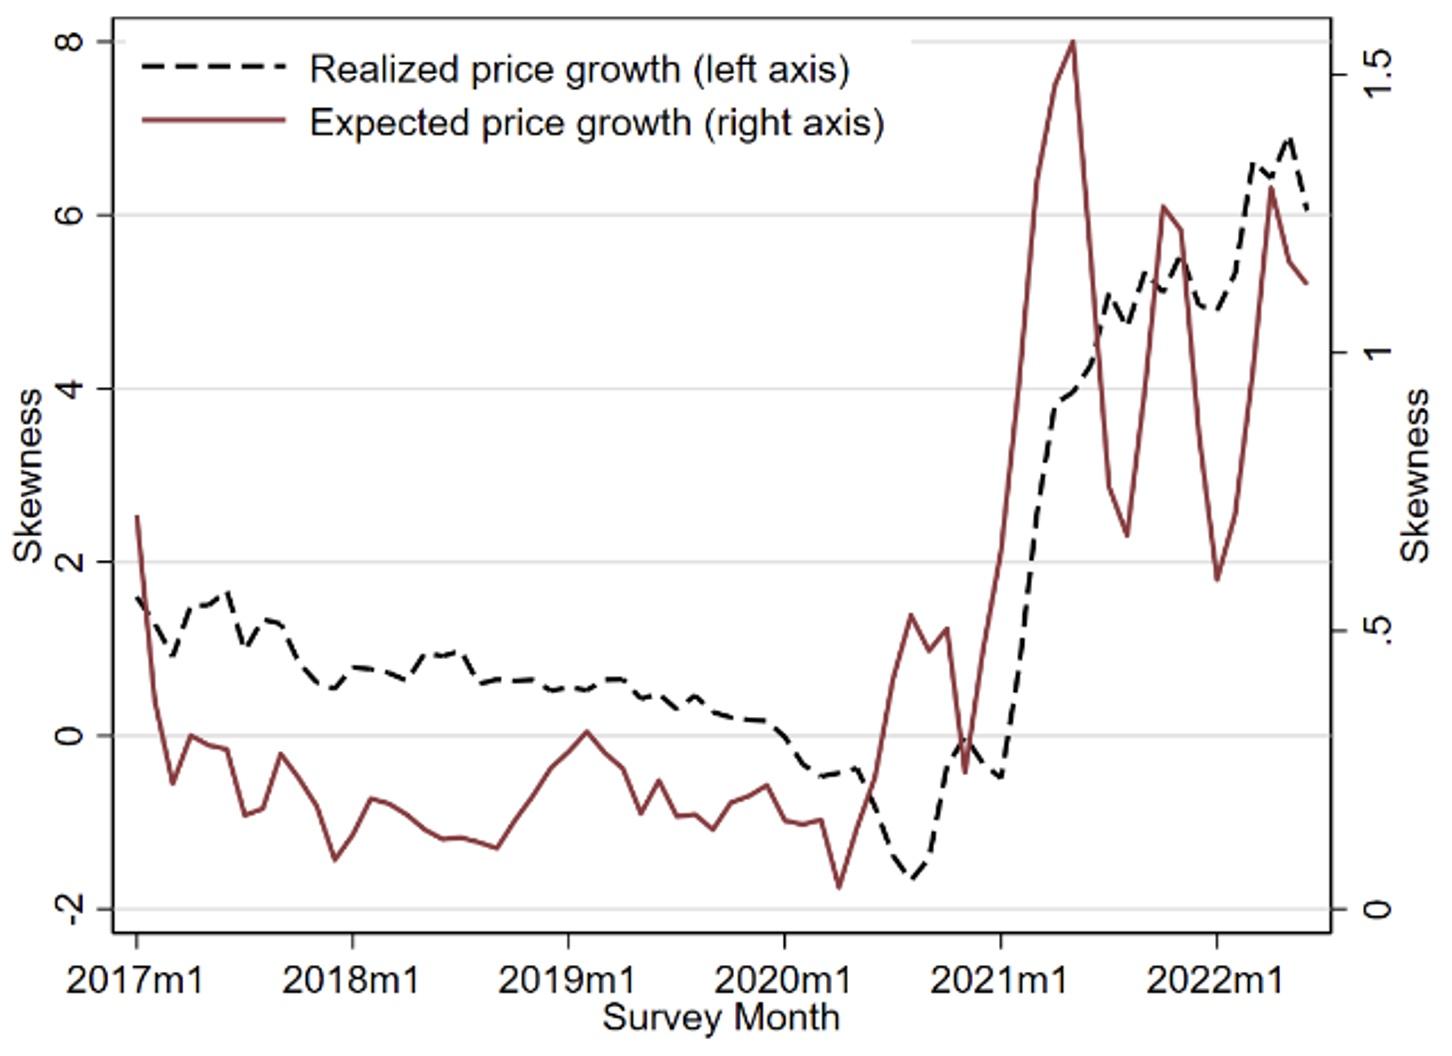
At the same time, Figure 3 Panel B documents a sharp increase in the skewness of price growth since the start of 2021. The change in dispersion and skewness underline the highly heterogeneous shocks affecting firms over the past two years, with rises in energy prices as well as supply and labour shortages affecting some businesses by much more than others.
Further analysis in Bunn et al. (2022) shows that both higher dispersion and positive skewness are strongly positively associated with higher price growth. These findings are consistent with menu cost models with trend inflation in the spirit of Ball and Mankiw (1994, 1995). We plan to explore the mechanisms behind our empirical results further in future work, but they imply that the distribution of shocks can be an important factor in understanding inflation dynamics.
Figure 3 Standard deviation and skewness of realised price inflation
Panel A) Standard deviation
Panel B) Skewness
Notes: Panel A presents the standard deviation of realised and expected price growth across firms in the DMP. Panel B presents the skewness of realised and expected price growth across firms in the DMP. All series are presented as three-month moving averages.
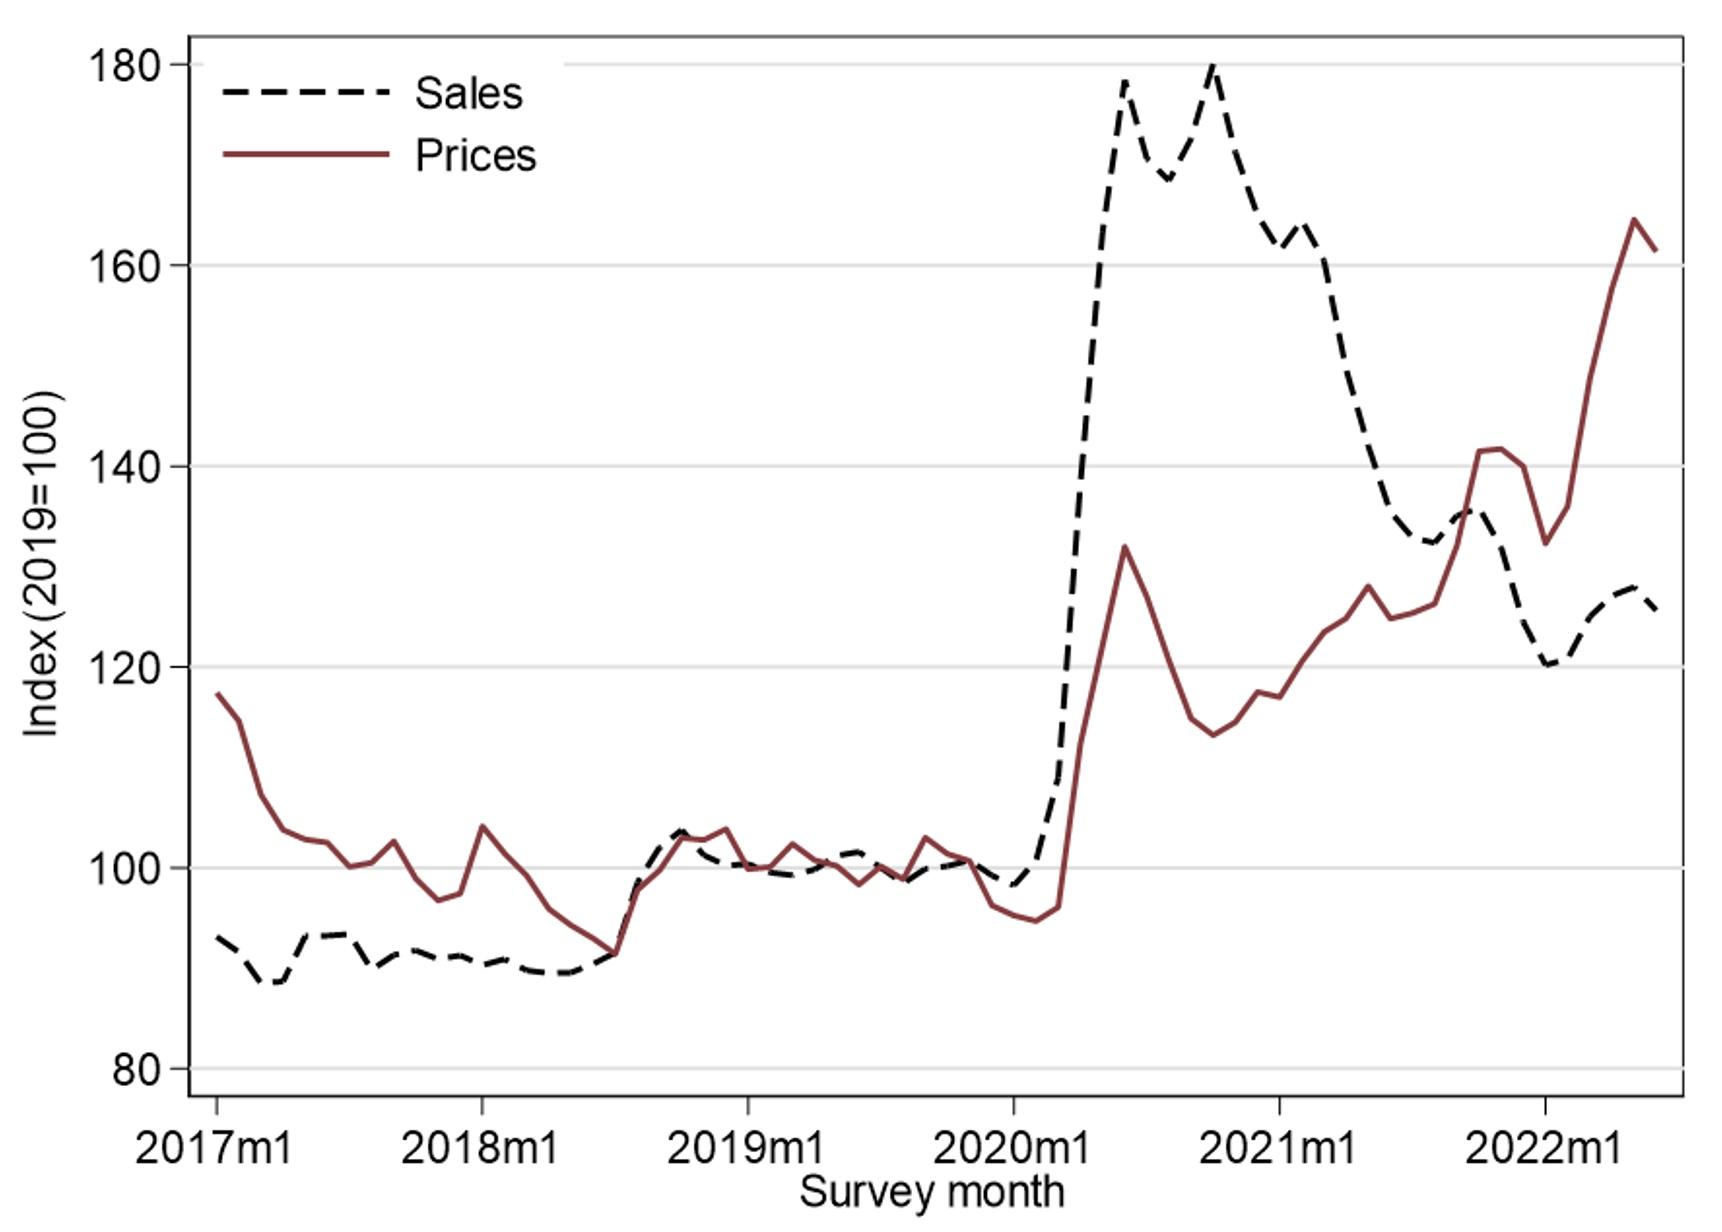
Finally, respondents in the DMP survey are asked about the distribution of expected outcomes for their business. This allows us to calculate a standard deviation of expected year-ahead growth for each firm. We take the average across firms to construct measures of ‘subjective’ uncertainty for sales and prices and present these in Figure 4. Relative to the average levels in 2019, sales uncertainty increased dramatically in the first year of the pandemic, before starting to decrease gradually in 2021. The evolution of subjective price uncertainty has been quite different: after increasing by less in the initial stages of the pandemic, uncertainty about expected prices within firms has continued to grow and currently stands at the highest level since the start of the pandemic. Price uncertainty is not without consequences: in Bunn et al. (2022) we show that it is associated with larger forecast errors, which could limit the ability of firms to plan ahead and allocate resources efficiently.
Figure 4 Within-firm subjective uncertainty
Notes: This figure presents the evolution of within-firm subjective uncertainty regarding prices and sales. Subjective uncertainty is calculated using the distribution of expected outcomes provided by firms in the DMP. Both series are normalised to their respective average values in 2019 and shown as three-month moving averages.
Conclusion
Inflation in the UK is now at levels not seen for 30 years, following an energy price shock, persistent supply disruptions, and labour market tightness. Using the DMP survey, we analyse firm price growth since the start of the pandemic and emphasise the heterogeneous nature of the Covid-19 shock to businesses. A deeper understanding of the forces driving firm price setting will help develop accurate theoretical models as well as inform policymakers in times of uncertainty.
Authors’ note: The views expressed in this column are those of the authors, and not necessarily those of the Bank of England or its committees.
References
Altig, D E, S Baker, J M Barrero, N Bloom, P Bunn, S Chen, S Davis, J Leather, B Meyer, E Mihaylov, P Mizen, N Parker, T Renault, P Smietanka and G Thwaites (2020), “Economic uncertainty in the wake of the Covid-19 pandemic”, VoxEU.org, 24 July.
Anayi, L, N Bloom, P Bunn, P Mizen, G Thwaites and I Yotzov (2022), “The impact of the war in Ukraine on economic uncertainty”, VoxEU.org, 16 April.
Ball, L and N G Mankiw (1994), “Asymmetric price adjustment and economic fluctuations”, The Economic Journal 104(423): 247-261.
Ball, L and N G Mankiw (1995), “Relative-price changes as aggregate supply shocks”, The Quarterly Journal of Economics 110(1): 161-193.
Beck, G W, K Carstensen, J-O Menz, R Schnorrenberger and E Wieland (2022), “Real-time food price inflation in Germany in light of the Russian invasion of Ukraine”, VoxEU.org, 24 June.
Blanchard, O (2022), “Why I worry about inflation, interest rates, and unemployment”, PIIE Real-time economic issues watch, 14 March.
Bloom, N, S Chen and P Mizen (2018), “Rising Brexit uncertainty has reduced investment and employment”, VoxEU.org, 16 November.
Bloom, N, P Bunn, S Chen, P Mizen and P Smietanka (2020a), “Brexit uncertainty has fallen since the UK general election”, VoxEU.org, 25 February.
Bloom, N, F Guvenen and S Salgado (2020b), “COVID-19: The skewness of the shock”, VoxEU.org, 5 May.
Bunn, P, D E Altig, L Anayi, J M Barrero, N Bloom, S Davis, B Meyer, E Mihaylov, P Mizen and G Thwaites (2021), “Covid-19 uncertainty: A tale of two tails”, VoxEU.org, 16 November.
Bunn, P, L Anayi, N Bloom, P Mizen, G Thwaites and I Yotzov (2022), “Firming up price inflation”, Bank of England Staff Working Paper 993.
Carriere-Swallow, Y, P Deb, D Furceri, D Jimenez and J D Ostry (2022), “Shipping costs and inflation”, IMF Working Paper 2022/061.
Davies, R (2021), “Prices and inflation in a pandemic – a micro data approach”, Centre for Economic Performance Covid-19 Analysis Series No. 017.
Eo, Y, L Uzeda and B Wong (2022), “Goods inflation is likely transitory, but upside risks to longer-term inflation remain”, VoxEU.org, 29 April.
Forbes, K, J Gagnon and C G Collins (2021a), “Pandemic inflation and nonlinear, global Philips curves”, VoxEU.org, 21 December.
Forbes, K, J Gagnon and C G Collins (2021b), “Low inflation bends the Phillips curve around the world”, CEPR Discussion Paper 16583.
Fornaro, L and F Romei (2022), “Understanding the global rise in inflation”, VoxEU.org, 27 May.
Gagnon, J E (2022), “The inflation story differs across major economies”, PIIE Real-time economic issues watch, 30 June.
Tanaka, M, N Bloom, J David and M Koga, (2020), “Firm performance and macro forecast accuracy”, Journal of Monetary Economics 114(C): 26-41.
Vehbi, T, S Sengul, D Christen, L D’Aguanno and T Wise (2022), “The impact of shipping costs and inflation”, Bank Underground, 2 March.
World Bank (2022), Commodity Markets Outlook: The Impact of the War in Ukraine on Commodity Markets, April.
