The COVID-19 pandemic initiated a rapid and enduring shift to remote work that surveys suggest will persist for the foreseeable future in many countries around the world (Criscuolo 2021, Zarate et al. 2022). There are few, if any, modern precedents for such an abrupt, large-scale shift in working arrangements. At the same time, we still lack evidence on where this shift is taking place at a micro level because the sample sizes that underlie the survey evidence are not sufficiently large. This evidence is a vital input as economists seek to understand what drives certain firms to supply – and certain workers to demand – remote and hybrid opportunities. Our new paper (Hansen et al. 2023) fills this measurement gap in the literature.
The data we use to solve this problem is the near-universe of job postings in five English-speaking countries (the US, UK, Canada, Australia, and New Zealand), which we obtain from Lightcast (formerly Emsi Burning Glass). There are more than 250 million postings in total. We then propose a method for mapping the unstructured text of each posting into an indicator for whether it offers at least one day per week of remote work. Our statistics are available at https://wfhmap.com/.
Measurement
The basic problem is detecting whether a concept – in this case, the offering of remote work at least one day per week – is present in the text of each individual job posting. The traditional approach is to count keywords indicating the presence of the concept (Ash and Hansen 2023), a method applied by Adrjan et al. (2021) and Draca et al. (2022) in the remote work context. The main challenge is that keywords such as “remote” convey different meanings depending on context: “this position allows for remote work” and “this position involves working on remote sites” clearly indicate different work arrangements.
Instead, we build a large-language model for concept detection. This begins by taking a sample of 10,000 texts and having three human labellers code each one as offering remote work or not. We then refine a variant of the popular BERT model (Devlin et al. 2019, Sahm et al. 2020) to target the successful prediction of these human labels. Our approach yields 99% accuracy in classifying job postings, greatly surpassing the accuracy achieved by keyword methods and also outperforming other machine-learning methods.
Finally, we take our estimated model out-of-sample and impute a label to every posting in the data. Effectively, this method scales up human judgment to a sample that is far beyond the scope of what actual humans could reasonably label. We call the result the work-from-home algorithmic measure (WHAM), and we use it to document variation in remote work offerings along several dimensions.
Results
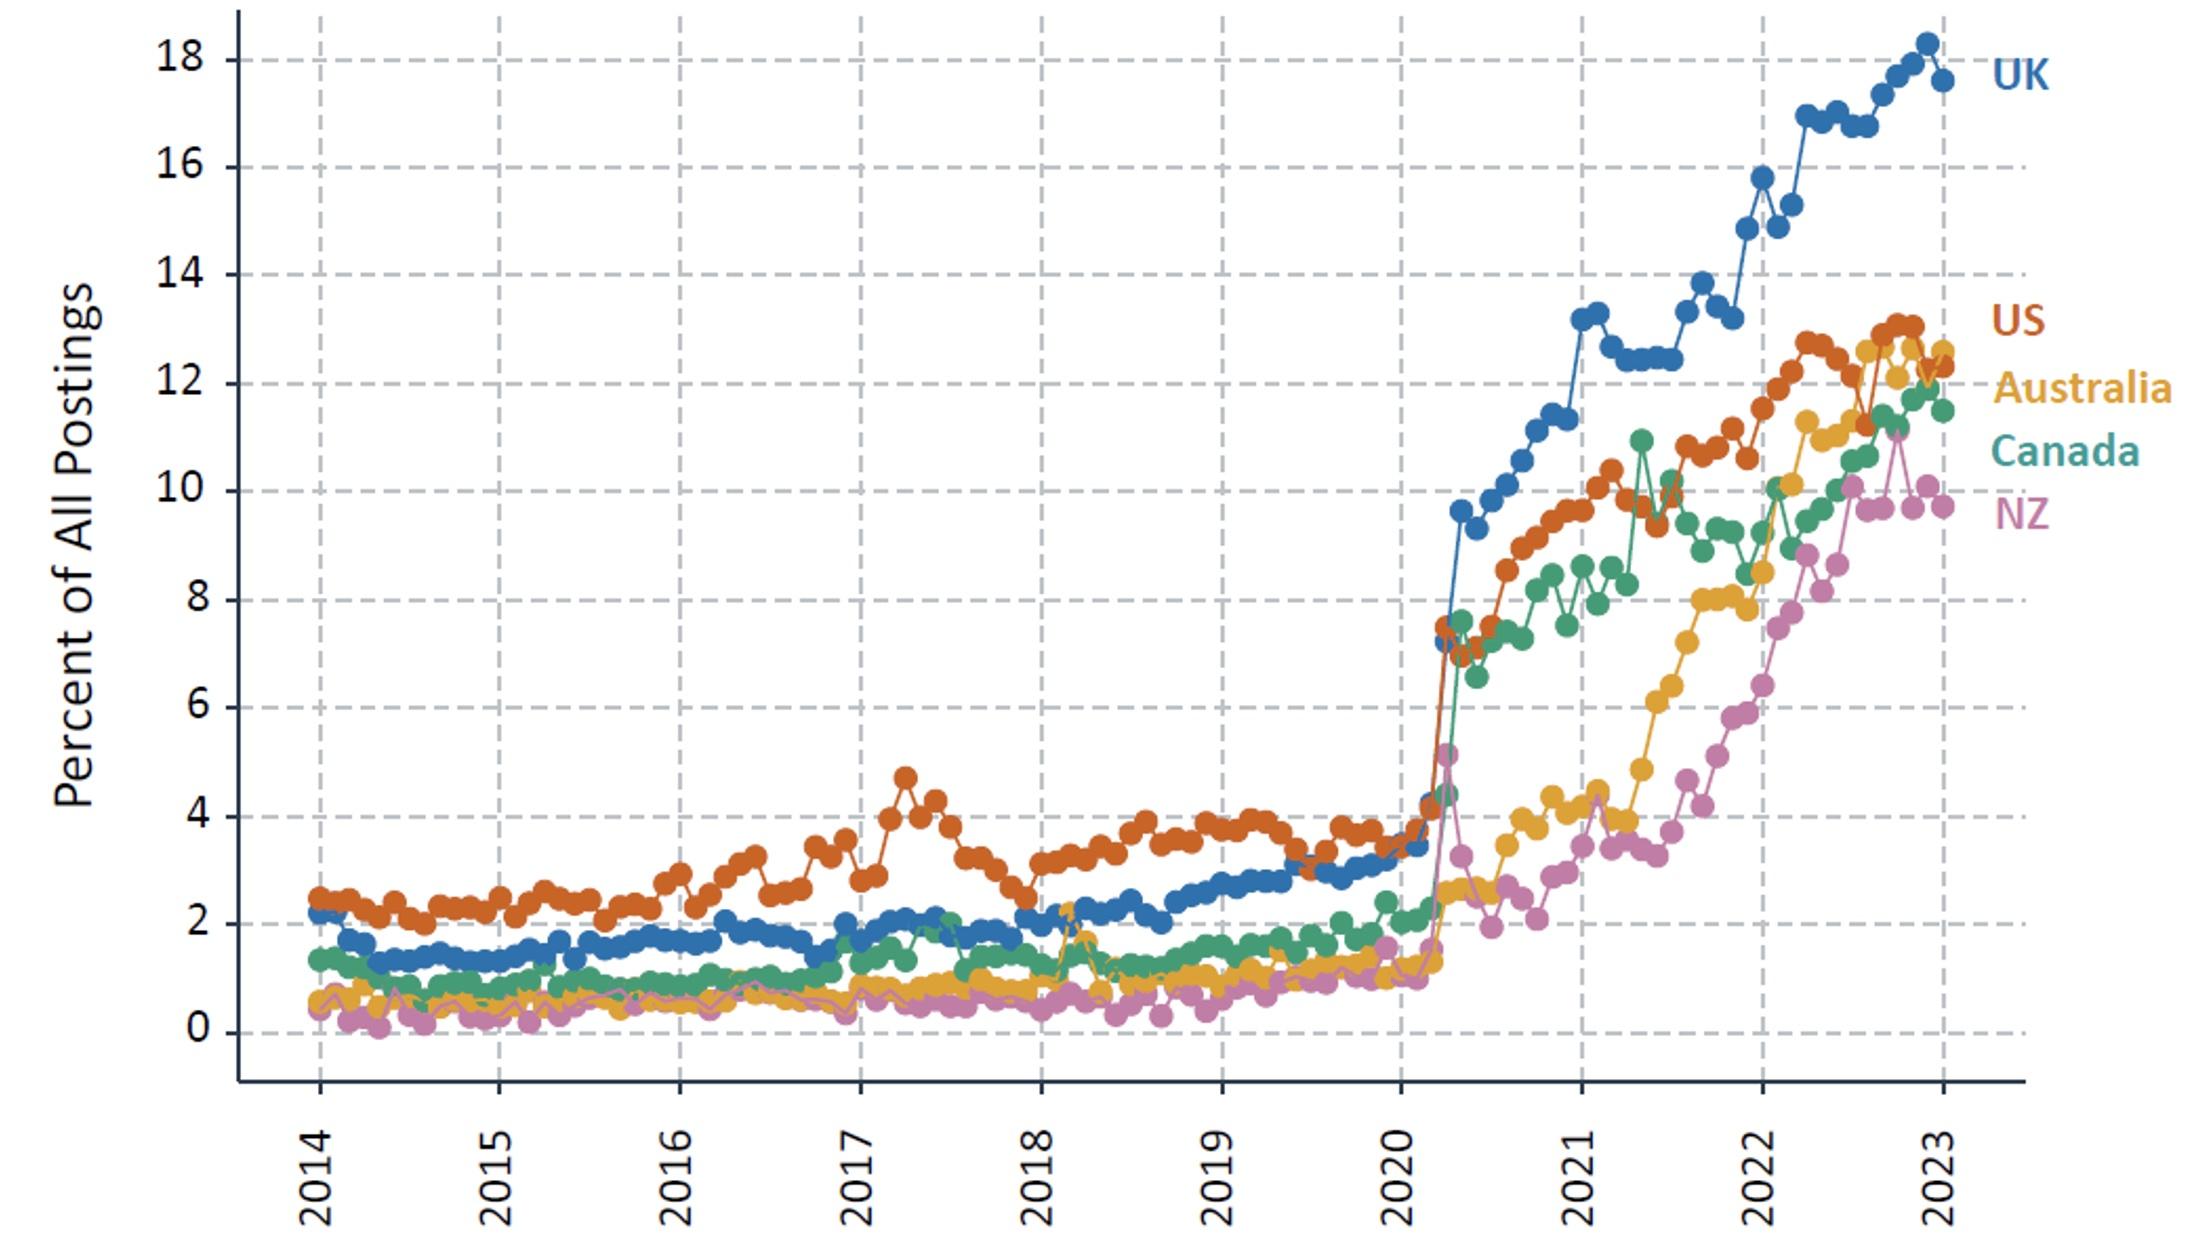
Figure 1 below displays monthly WHAM-based time series in each of the five countries. From 2014–2020, remote work grew slowly; it surged at the onset of the pandemic, and afterwards continued to grow through to the present. These COVID-era dynamics differ from surveys on the number of days actually worked from home, which exceeded 50% in the US in spring 2020 before falling gradually to reach 28% as of early 2023 (Barrero et al. 2021 and WFHresearch.com). Our measure reflects an explicit statement of intent by the employer to offer remote work, which might differ from actual remote work. Firms may prefer to offer remote work contingently rather than in writing. Also, in some cases the remote work option may be common knowledge for prospective employees and require no mention in job postings. For example, many university professors can and do work remotely a day or so per week, but job ads for professors rarely tout the option to work from home. In any case, the overall trend in our data is clear: a rapid increase in remote work offers around the world that shows no sign of reversal.
Figure 1 Vacancy postings that explicitly offer hybrid or fully remote work rose sharply in all five countries from 2020
Notes: This figure shows the percent of vacancy postings that say the job allows one or more remote workdays per week, encompassing both hybrid and fully remote working arrangements. We compute these monthly, country-level shares as the weighted mean of the own-country occupation-level shares, with weights given by the US vacancy distribution in 2019. Our occupation-level granularity is roughly equivalent to six-digit SOC codes.
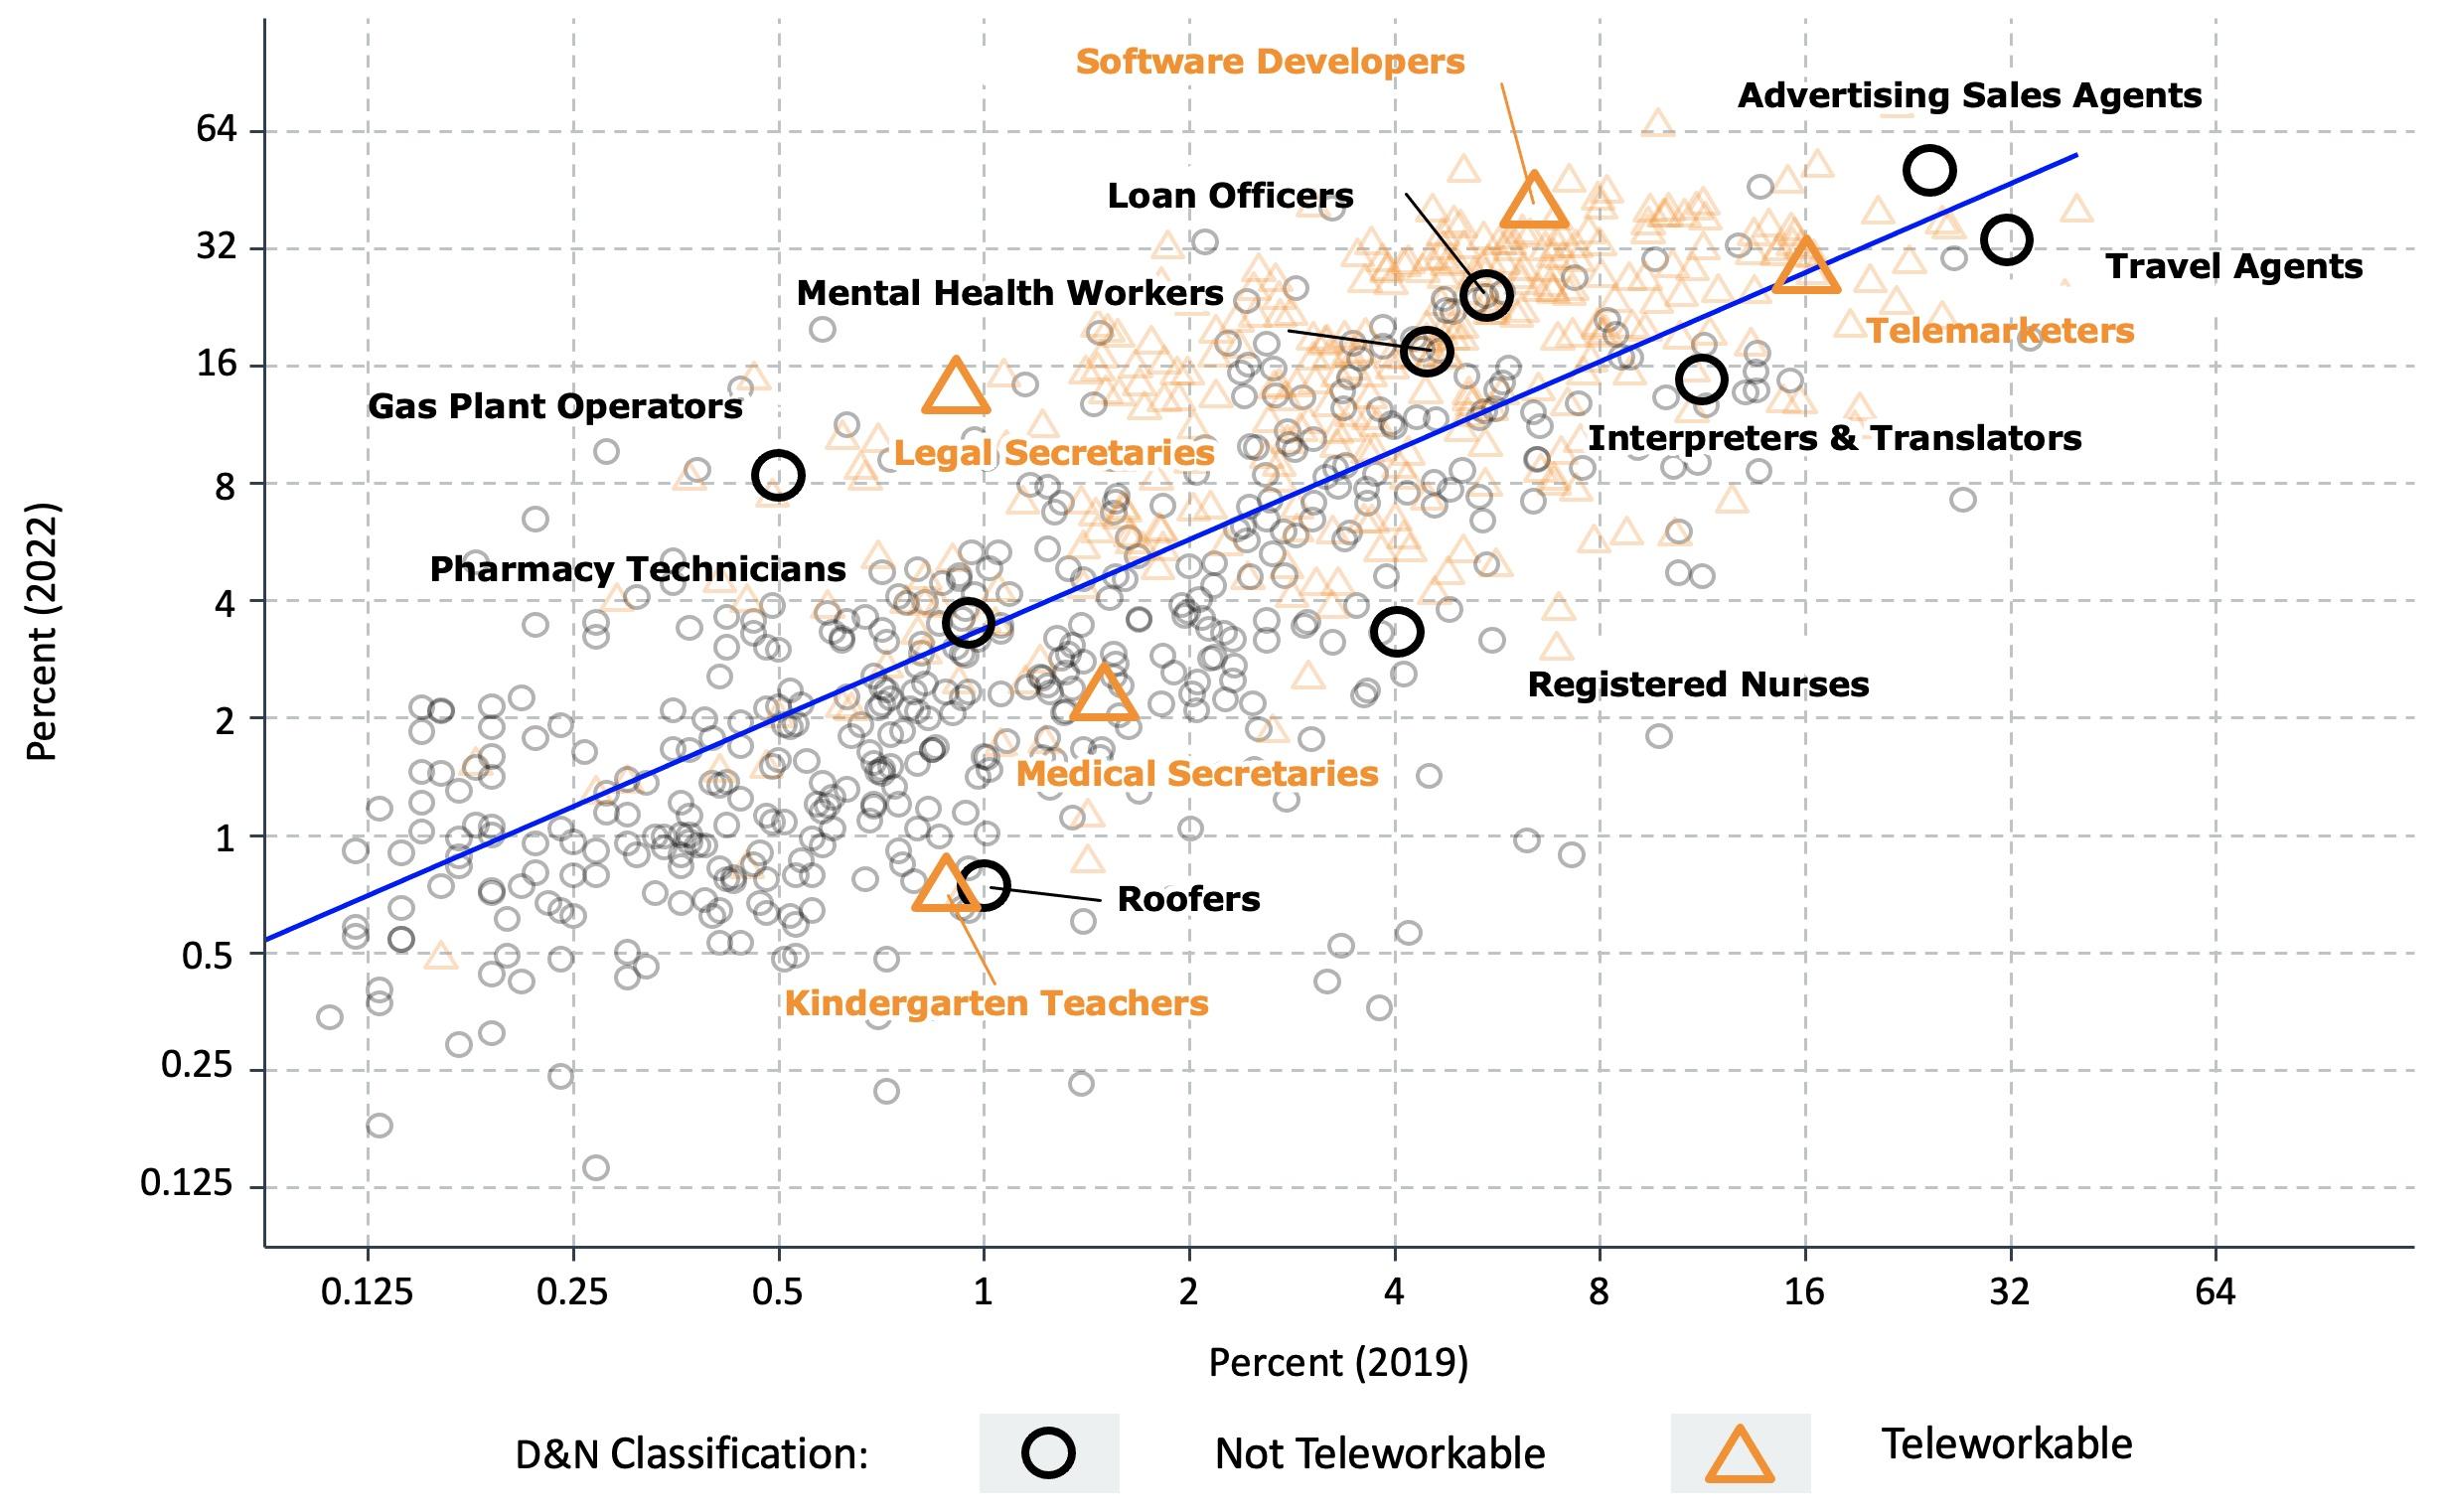
Figure 2 displays occupation-level remote work offerings in 2019 and 2022. We colour code occupations using the widely adopted classification of Dingel and Neiman (2020), which is based on O*NET task descriptions. As of 2022, the average share of remote-work offerings ranges from 0 to 0.50 in ‘not teleworkable’ occupations (as defined by Dingel and Nieman) and from 0.003 to 0.74 in ‘teleworkable’ occupations. Clearly, job postings reveal much more variation in remote work than the binary classification.
Figure 2 The share of vacancy postings that explicitly offer hybrid or fully remote work rose in almost every occupation, US data
Notes: This figure plots the percent of postings that say the job allows one or more remote workdays per week for 875 occupations in 2019 and 2022. We define occupations by ONET codes, dropping those with fewer than 250 postings in 2019.
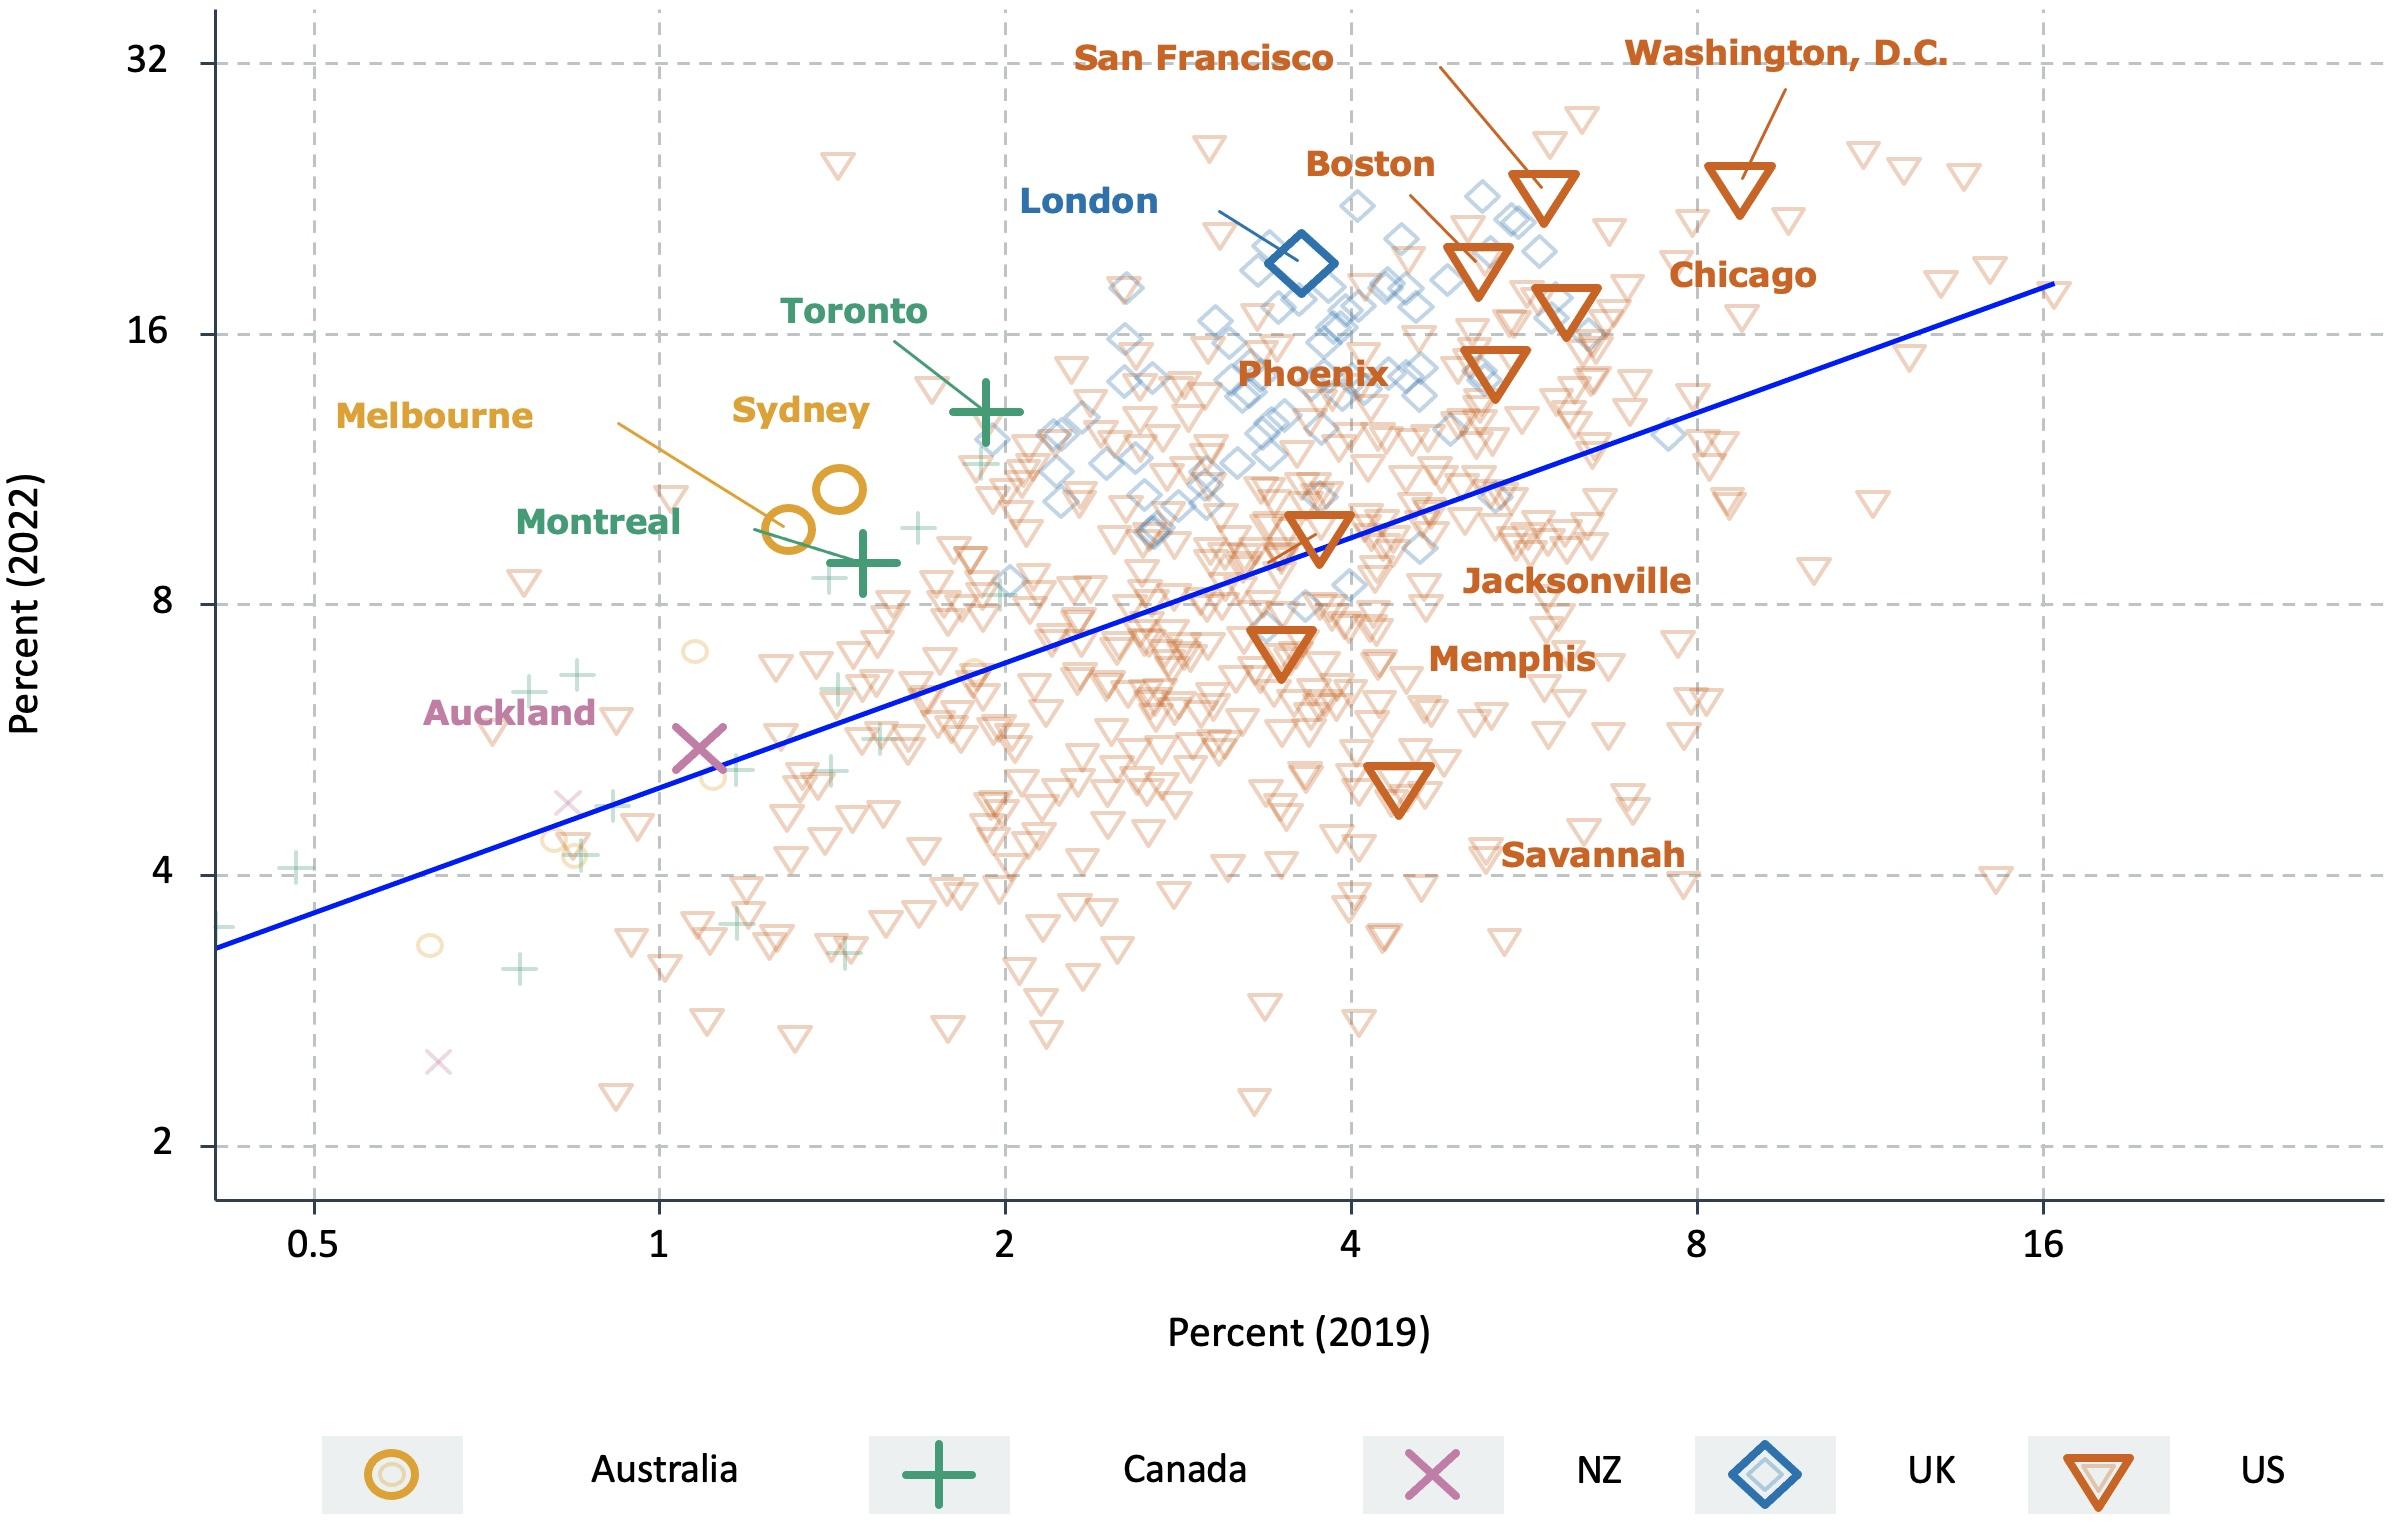
Figure 3 is an analogous plot for cities rather than occupations. In contrast to occupations, the 2019 remote work share is not so strongly related to the 2022 remote work share: 2019 variation in city-level remote work shares explains only 28% of the 2022 variation. The corresponding figure for occupations is 63%. This raises an interesting question: What are the city-level determinants of remote work adoption? We hypothesise that a range of institutional features – infrastructure quality, mortality outcomes, policy responses to the pandemic – and the mix of industries and occupations in each city are all important factors. We plan to explore this matter in future work.
Figure 3 The share of vacancy postings that explicitly offer hybrid or fully remote work grew at different rates across cities since the pandemic
Notes: This figure plots the city-level percent of postings that say the job allows one or more remote workdays per week in 2019 and 2022. ‘City’ refers to the location of the establishment or firm that is hiring.
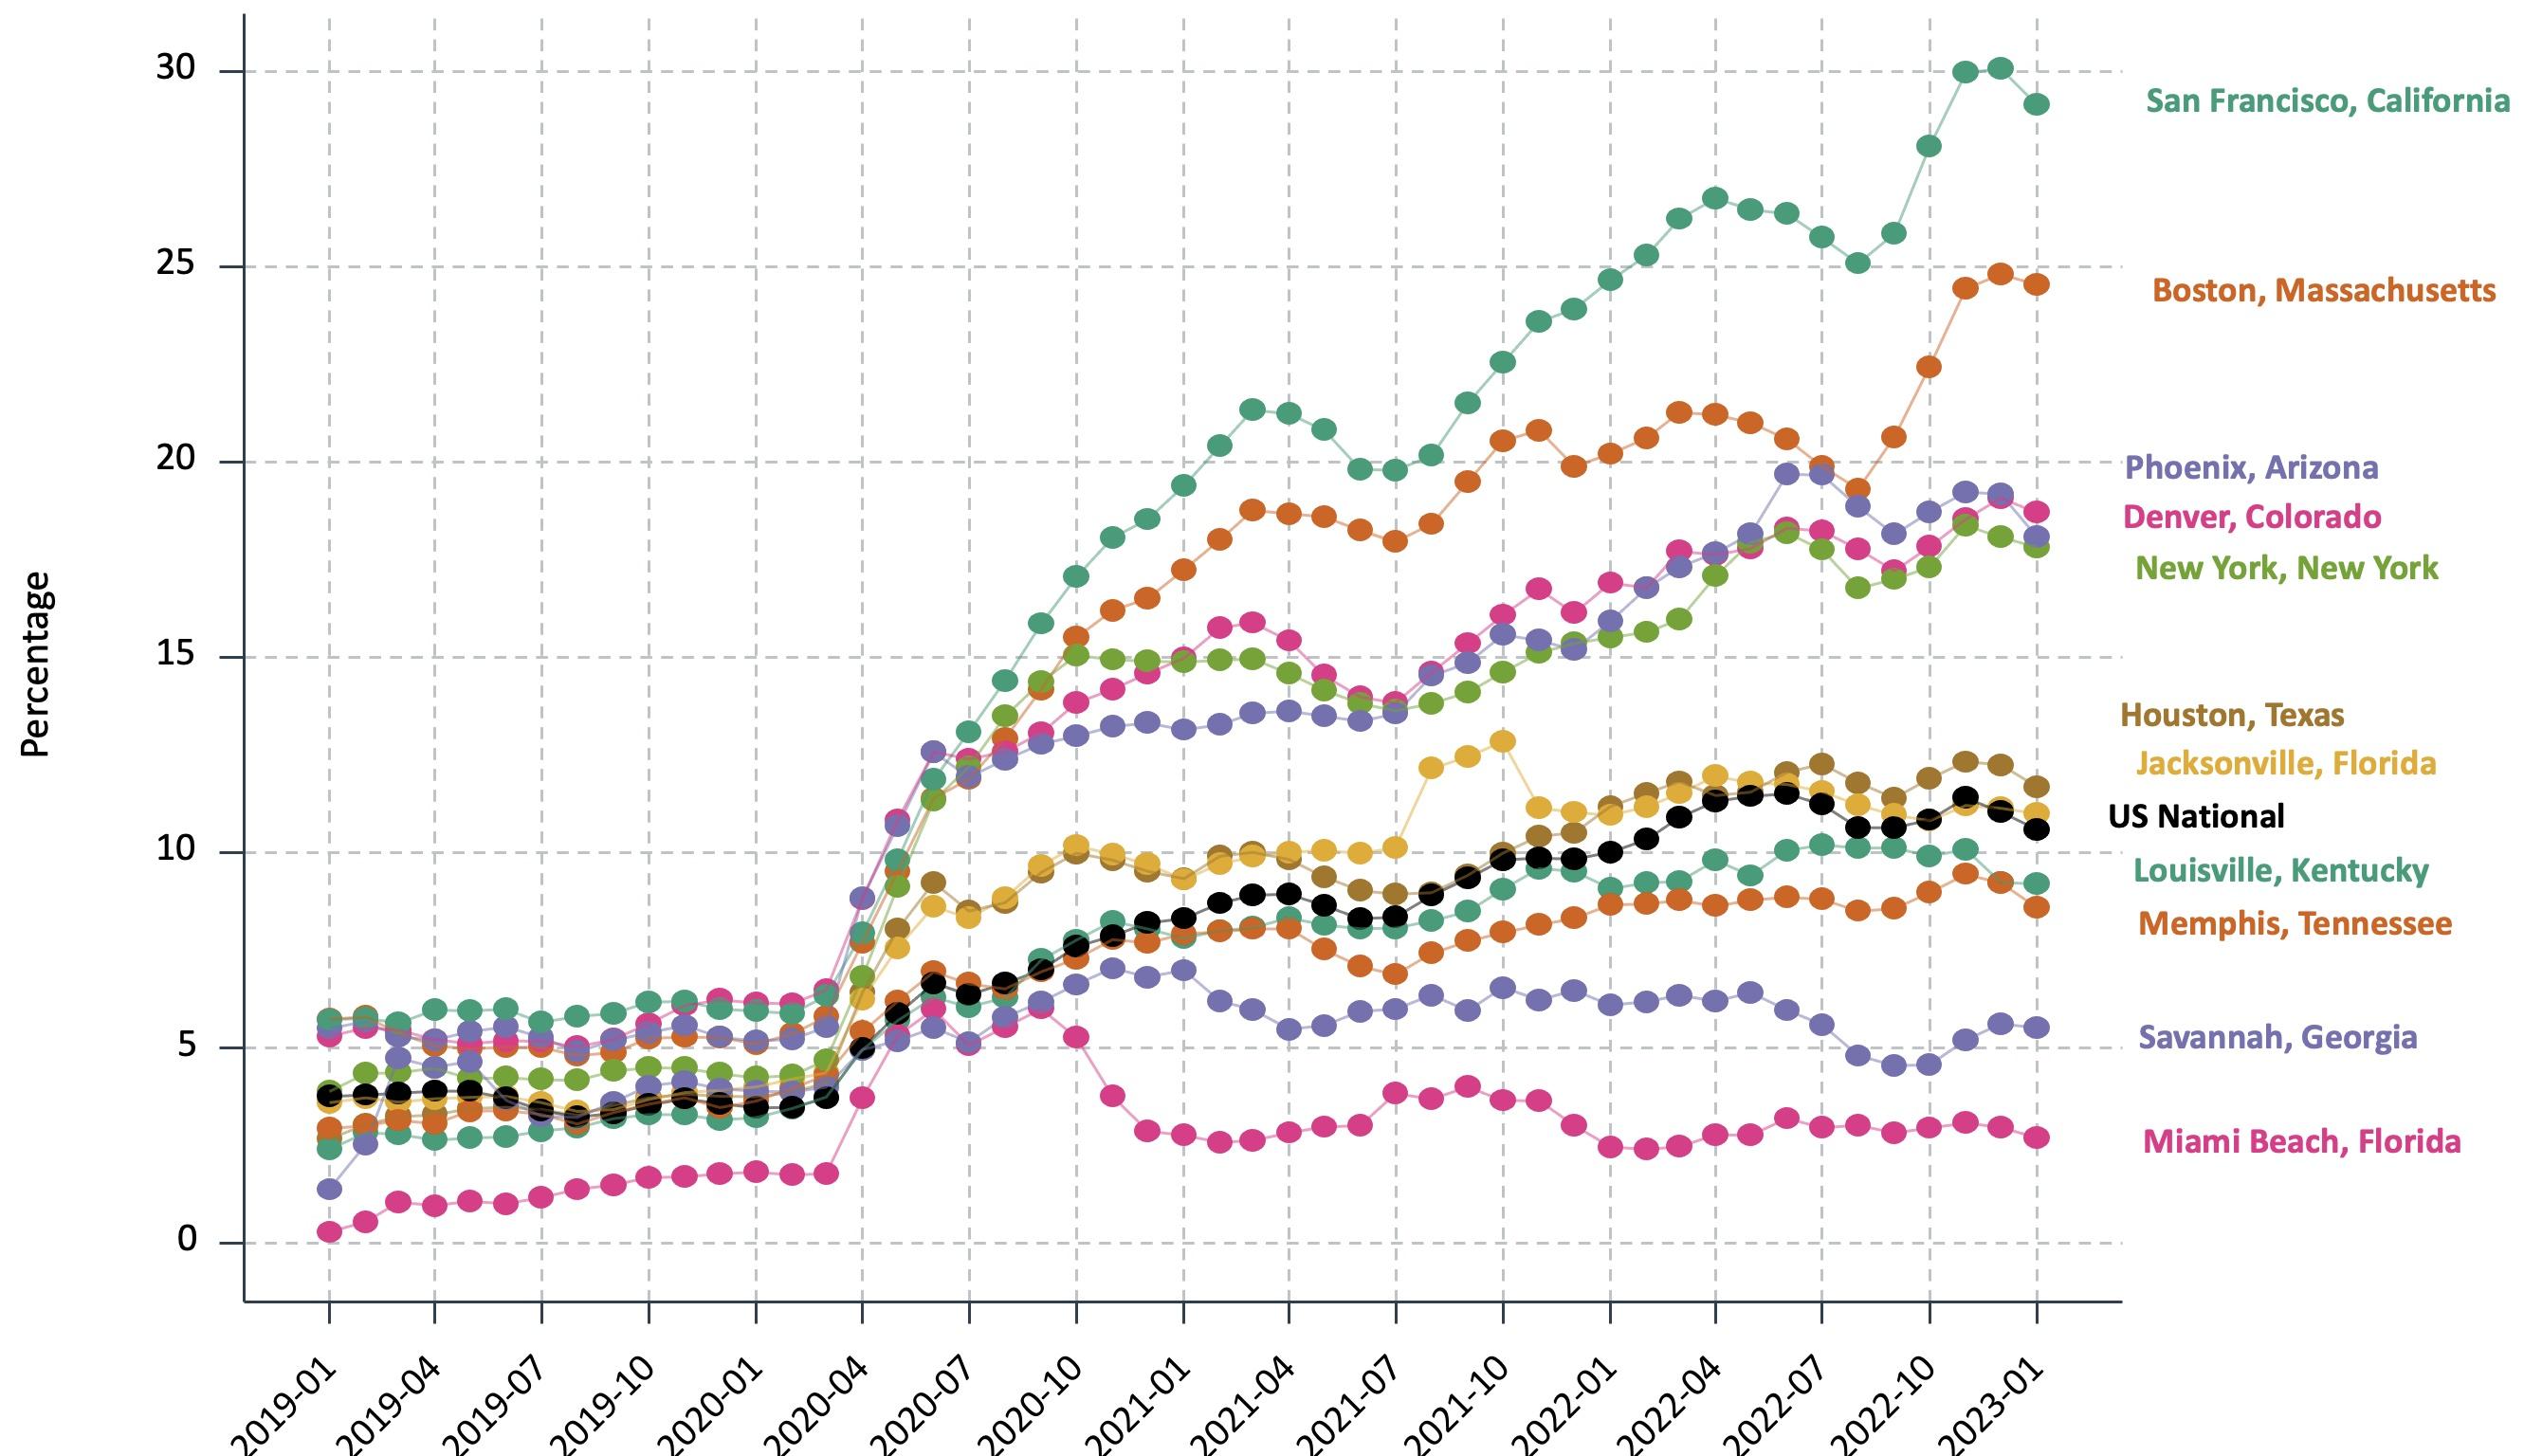
Figure 4 provides an alternative view of cross-city variation within the US by presenting monthly time series. Coastal and higher-density cities tend to have higher levels of remote work offerings, with lower levels in southern states. More broadly, our city-level measures are arguably among the highest quality currently available. They are available at a monthly frequency, with a lag measured in weeks. Moreover, they exist for dozens of cities and can be crossed with occupation to control for the composition of the workforce. We show in Hansen et al. (2023) that, among comparable cities, our measure also co-moves strongly with the American Community Survey’s annual measure based on worker surveys.
Figure 4 Share of postings offering hybrid or fully remote work vary across US cities
Notes: We show the monthly share of all new job vacancy postings that explicitly advertise remote working arrangements (i.e. both hybrid and fully remote) for selected cities. This figure shows the three-month moving average. Cities are selected to illustrate the wide cross-city spread.
Our final cut is at the firm level. Even for firms operating in the same narrow industry and hiring in the same occupation, we find substantial divergence. For example, remote work offerings were essentially zero for managers in 2019 for Boeing, Lockheed Martin, and SpaceX, all of which operate in the aerospace sector. In contrast, the 2022 shares for the first two firms exceed 50%, while for SpaceX the share remains miniscule. This highlights that the decision to offer remote work extends well beyond technical feasibility, and instead reflects policy choices of firms.
Conclusion
The pandemic triggered a large, enduring increase in remote work. Understanding why and how this shift takes place at the micro level will be an important topic of research over the coming years. Our work provides an evidence base to inform this effort. Our data are available at https://wfhmap.com/ for interested researchers. We also advance text-as-data methodology in economics by showing how modern language models can achieve highly accurate classifications in economically relevant measurement problems. This approach can be applied to the detection of any economic concept of interest in a large text corpus.
References
Adrjan, P, G Ciminelli, A Judes, M Koelle, C Schwellnus and T Sinclair (2021), “Will it stay or will it go? Analysing developments in telework during COVID-19 using online job postings data”, OECD Productivity Working Papers, 2021–30, Paris.
Ash, E and S Hansen (2023), “Text Algorithms in Economics”, Annual Review of Economics, forthcoming.
Barrero, J M, N Bloom and S J Davis (2021), “Why working from home will stick”, NBER Working Paper 28731.
Criscuolo, C, P Gal, T Leidecker, F Losma and G Nicoletti (2021), “The role of telework for productivity during and post-COVID-19”, OECD Productivity Working Papers, 2021–31, Paris.
Devlin, J, M-W Chang, K Lee and K Toutanova (2019), “BERT: Pre-training of Deep Bidirectional Transformers for Language Understanding”, Proceedings of the 2019 Conference of the North American Chapter of the Association for Computational Linguistics: Human Language Technologies, vol. 1, 4171–4186, Minneapolis, Minnesota.
Dingel, J I and B Neiman (2020), “How many jobs can be done at home?”, Journal of Public Economics 189: 104235.
Draca, M, E Duchini, R Rathelot, A Turrell and G Vattuone (2022), “Revolution in Progress? The Rise of Remote Work in the UK”, CAGE Working Paper 616.
Hansen, S, P Lambert, N Bloom, S Davis, R Sadun and B Taska (2023), “Remote Work across Jobs, Companies, and Space”, CEPR Discussion Paper 17964.
Sanh, V, L Debut, J Chaumond and T Wolf (2020), “DistilBERT, a distilled version of BERT: Smaller, faster, cheaper and lighter”, arXiv:1910.01108.
Zarate, P, M Dolls, S Davis, N Bloom, J M Barrero and C G Aksoy (2022), “Working from home around the world”, VoxEU.org, 8 October.


